Fig. 4.

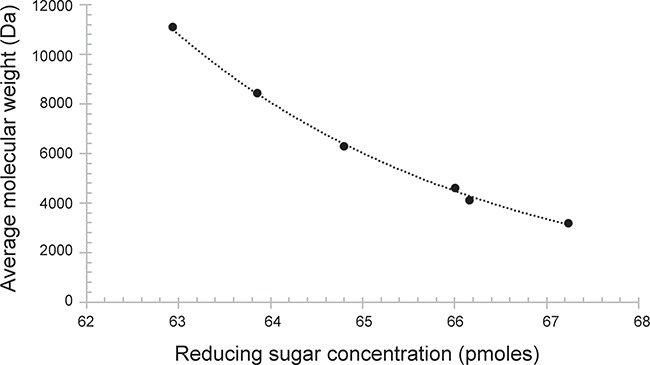
Molecular weight (Da) is plotted as a function of concentration (pmol) of reducing end sugar throughout the time course of heparanase Bp catalyzed depolymerization of HS.

Molecular weight (Da) is plotted as a function of concentration (pmol) of reducing end sugar throughout the time course of heparanase Bp catalyzed depolymerization of HS.