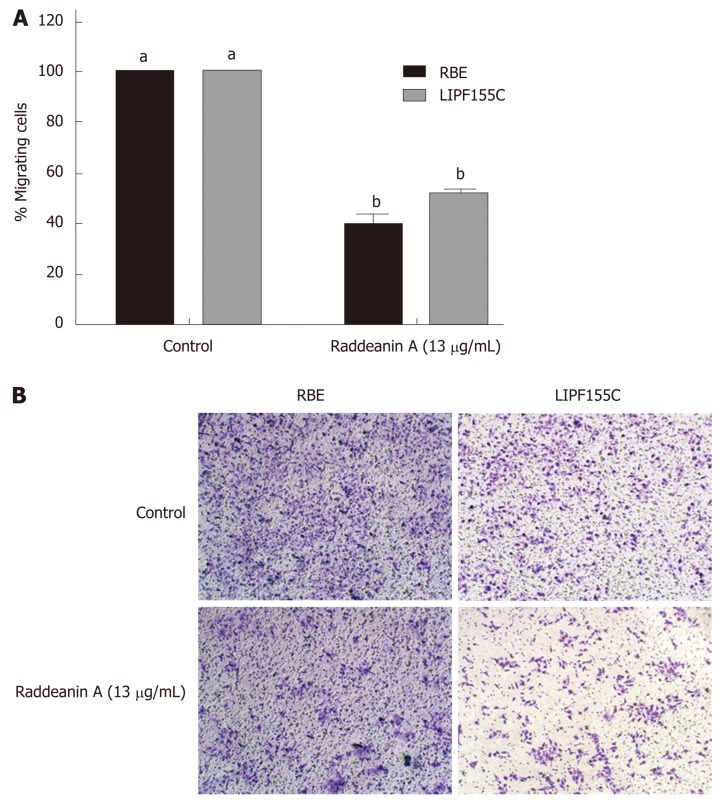
Figure 3.
Transwell migration and clonogenic assays of RBE and LIPF155C cell lines treated with raddeanin (13 µg/mL) (n = 3 independent experiments). A: The percentage of migration cells normalized to the controls are shown and data are expressed as the mean ± standard deviation. Unique letters shared by the bars suggest significant differences between groups and P < 0.05 was regarded to be statistically significant; B: Representative histograms for cell colony formation.

