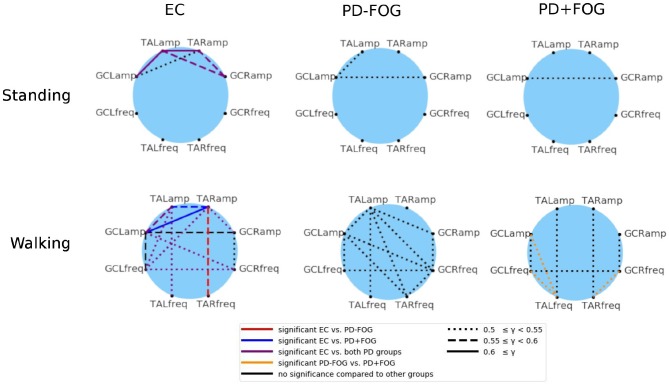
Figure 3.
(Color online) Network representation of phase synchronization between EMG-derived amplitudes (four nodes in the top half of each circle, both legs and both muscles) and EMG-derived frequencies (four nodes in the bottom half of each circle). A link is plotted if the corresponding average value of the synchronization index γ (see Equation 2) exceeds an ad-hoc limit of 0.5. The link strength is indicated by different line styles (see figure legend): (i) dotted line for 0.5 ≤ γj,k < 0.55, (ii) dashed line for 0.55 ≤ γj,k < 0.6, and (iii) solid line for γj,k ≥ 0.6. The six network plots show group averages for EC (left), PD-FOG (center), and PD+FOG (right) groups; the top panel is for a standing still trial and the bottom panel for figure-eight walking. It is interesting to note that for both PD groups during still standing there is a coupling between EMG amplitudes of GC which is absent in EC subjects. During walking, the amplitude-frequency synchronization increases for all groups, and is most pronounced for EC and much smaller for PD+FOG. Also, PD+FOG subjects show very weak synchronization between right and left leg. Statistically significant links are marked by the following colors (figure legend): (i) in the EC networks - red = links that are significant only for the EC to PD-FOG comparison, dark blue = links that are significant only for the EC to PD+FOG comparison, violet = links that are significant for both comparisons; (ii) in the PD+FOG networks: orange = links that are significant for the PD-FOG to PD+FOG comparison. Significance was probed performing Student's t-tests and the significance level was set to p < 0.05. TA, musculus tibialis anterior; GC, musculus gastrocnemius; R, right leg; L, left leg; amp, EMG amplitude signal; freq, EMG frequency signal.

