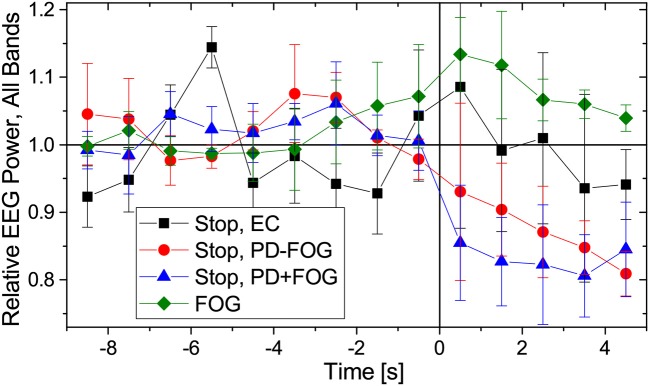
Figure 4.
(Color online) Relative changes of EEG amplitudes during normal walking (time: −9 to 0 s) followed by a commanded stop or FOG event (time: 0 to +5 s). As in Figure 2, data have been normalized to 1 for normal walking (time from −9 to −5 s). We have considered the following EEG frequency bands: theta (4–7.5 Hz), alpha (7.5–13 Hz), low beta (13–21 Hz), and high beta (21–35 Hz). Since we found no difference in how EEG amplitudes change for the respective frequencies, we present here an average over all four bands. EEG data from the central electrodes (C3 and C4 closest to the motor cortex) were used; results for other EEG electrodes are similar. Error bars indicate the standard deviations of the relative EEG powers across the four considered bands. As in Figure 2, points to the left of the vertical line are not affected by data recorded after time 0.

