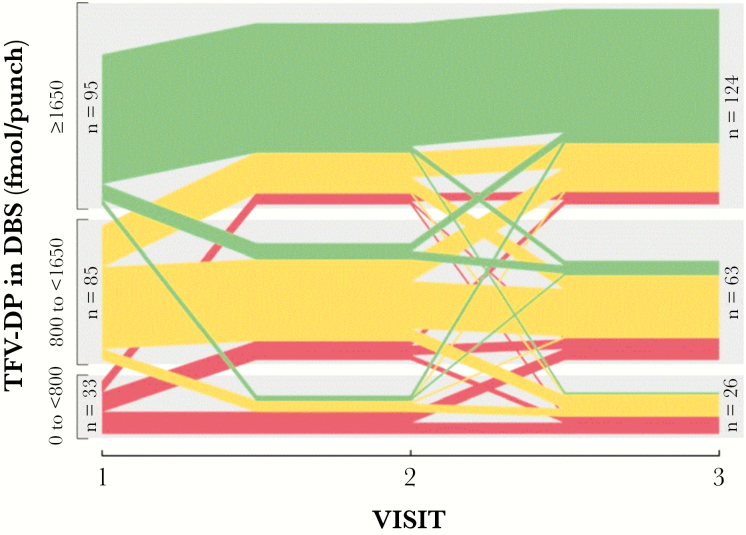
Figure 1.
Trajectory of TFV-DP in DBS in participants in whom drug concentrations were available for all 3 study visits (N = 213) according to drug concentration category. Colors represent TFV-DP categories with green indicating higher concentrations (≥1650 fmol/punch), yellow medium concentrations (800 to <1650 fmol/punch), and red low concentrations (BLQ to <800 fmol/punch) of TFV-DP. Each line within each category represents 1 participant. Individuals with the same progression of TFV-DP over time are grouped together forming thicker color bands. At visit 2, n = 115, n = 74, and n = 24 participants were included in the high, medium, and low concentrations, respectively. Abbreviations: BLQ, below limit of quantification; DBS, dried blood spots; TFV-DP, tenofovir diphosphate.

