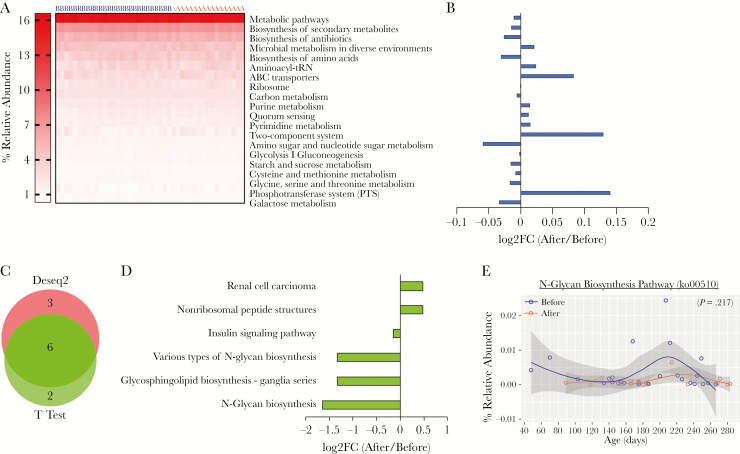
Figure 6.
Predicted metagenomic capacity at KEGG pathway level reveals no significant different pathway. Metagenomic capacity was predicted using Piphillin. (A) Heat map depicts the relative abundance of top 20 KEGG pathway before and after malaria episode/artemether-lumefantrine (AL) treatment and (B) the log2-fold change (log2FC) of these pathways. (C) KEGG pathways were normalized with DeSeq2, and differentially abundant pathways were analyzed with DeSeq2 and t test (P < .05) and (D) fold change (FC) of pathways common to both methods. (E) Relative abundance of N-glycan biosynthesis pathway having highest fold change. Data were analyzed by linear mixed-effects model. A, after malaria sample; B, before malaria sample.

