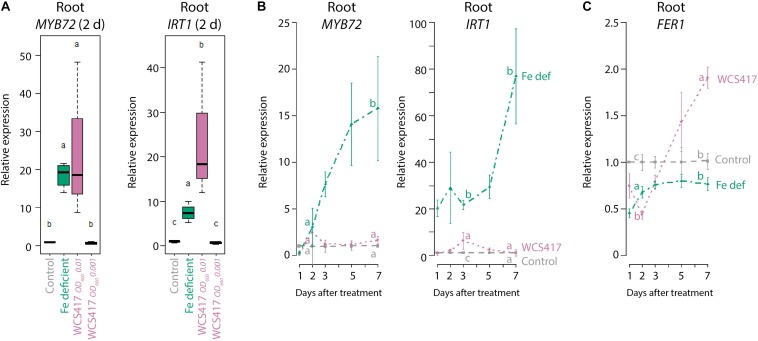
FIGURE 1.
ISR and Fe deficiency marker gene expression in roots in response to Fe starvation or WCS417. (A) qRT-qPCR analysis of MYB72 and IRT1 gene expression in roots of 7-day-old Col-0 plants at 2 days after transfer to Fe-deficient medium, or inoculation of the roots with a WCS417 suspension at OD600 = 0.01 or 0.001. (B,C) qRT-PCR analysis of MYB72, IRT1, and FER1 gene expression in roots of Col-0 plants at different time points after inoculation of 12-day-old roots with WCS417 at OD600 = 0.01, or transfer to Fe-deficient medium (Fe def). Gene expression levels were normalized to that of the constitutively expressed reference gene PP2AA3 (At1g13320). Plotted are fold changes in gene expression levels relative to that of the average of the control treatment. Error bars represent standard errors of the mean. Per timepoint, different letters indicate statistically significant differences between treatments (one-way ANOVA followed by Tukey’s test; P < 0.05; n = 4–5).

