Figure 1.

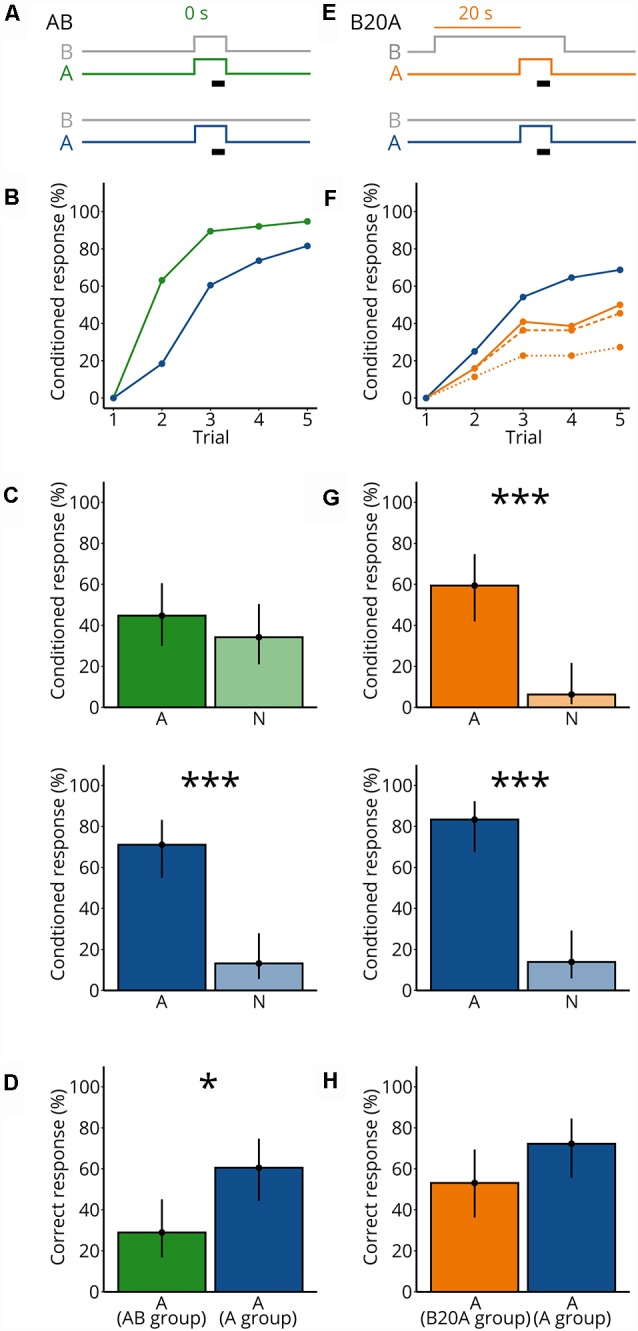
Mixing an unknown odorant A with an odorant blend B impairs detection of A. (A) Valve states for creating odorant pulses for the synchronous mixture AB and the control A. For AB, both A and the background B (gray) were turned on synchronously and were presented for 7 s. The black bar indicates the 4 s when the sucrose reward was given. For the control A, A (blue) was presented for 7 s. B (gray) was not presented. (B) Each bee received five rewarded conditioned trials either with AB (green) or A (blue); the percentage of bees responding to the odorants is shown. N = 38 bees conditioned to AB and 38 bees conditioned to A. (C) During the two test trials, each bee was stimulated with A and a novel odorant N. Percentage of bees responding to A and to N for bees conditioned to AB (green) and bees conditioned to A (blue). Points represent means and vertical lines represent 95% credible intervals for all panels in this figure. Stars indicate significant differences between means for all panels in this figure (*probability for a difference between both means p > 0.95; ***p > 0.999). (D) Percentage of correctly responding bees during the test (response to A but not to N) for bees conditioned to AB (green) and A (blue). (E) Valve states for creating odorant pulses for the asynchronous mixture B20A and the control A. For B20A, A (orange) was turned on 20 s after the background B (gray). A was presented for 7 s. B ended 3 s after A ended. Same control as in (A). (F) Same as in (B), but for B20A. Percentage of bees responding to only A (dotted line), only A or to both A and B within the same trial (dashed line), and to A and/or B (solid line) for bees conditioned to B20A (orange) and A alone (blue). N = 32 bees conditioned to B20A and 36 bees conditioned to A. (G) Same as in (C), but for B20A. (H) Same as in (D), but for B20A.
