Figure 1.
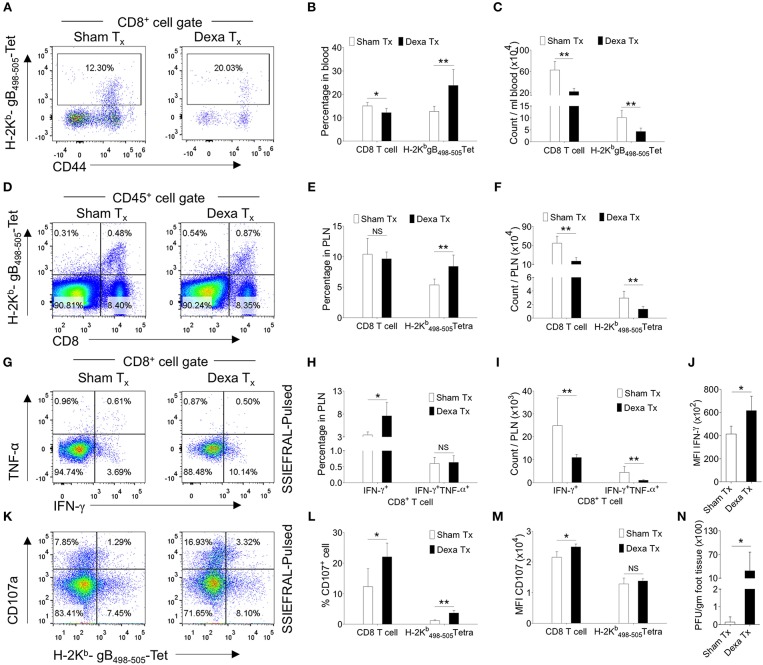
Dexamethasone therapy induces altered response in HSV1 infected animals. C57BL/6 mice were infected with HSV1-KOS (5 × 10⁵ pfu/foot pad) and were then injected with the diluent or dexamethasone (10 mg/Kg Bwt) intraperitoneally from 4 to 6 dpi. Distribution and phenotype of immune cells were analyzed in the peripheral blood circulation at 6 dpi (A–C) and draining popliteal lymph node (PLN) at 7 dpi (D–M). (A) Representative FACS plots from two groups show the frequency and phenotype of HSV-1 specific (H-2Kb-gB498−505-tetramer+ve) CD8+ T cells in the peripheral circulation. (B) Bar diagrams show the frequencies and absolute numbers of CD8+ T cells out of CD45+ leukocytes and HSV1 specific (H-2Kb-gB498−505-tetramer+ve) CD8+ T cells in peripheral blood. (C) Bar diagrams show the numbers of CD8+ T cells and HSV1-specific (H-2Kb-gB498−505-tetramer+ve) CD8+ T cells per ml of blood. (D) Representative FACS plots from two groups show the frequencies of HSV1 specific (H-2Kb-gB498−505-tetramer+ve) CD8+ T cells among CD45+ leukocytes present in draining popliteal LNs. (E) Percentage of total CD8+ T cells and HSV1 specific (H-2Kb-gB498−505-tetramer+ve) CD8+ T cells among CD45+ leukocytes present in draining popliteal LNs are shown by bar diagrams. (F) Total numbers of CD8+ T cells and HSV1 specific (H-2Kb-gB498−505-tetramer+ve) CD8+ T cells among CD45+ leukocytes present in draining popliteal LNs are shown by bar diagrams. (G–J) ICCS assays were performed by stimulating PLN cells with SSIEFARL peptide to measure cytokine producing CD8+ T cells in the PLNs of HSV1 infected and dexamethasone treated animals. The percentages and numbers of cytokine producing CD8+ T cells in PLN are shown by representative FACS plots (G) and bar diagrams (H). (I) Total numbers of CD8+ T cells that produced indicated cytokines are shown by bar diagrams. (J) The mean fluorescence intensities (MFI) for IFN-γ produced by peptide stimulated CD8+ T cells from control and dexamethasone group are shown by bar diagrams. Representative FACS plots (K) and bar diagrams (L,M) show the frequencies and numbers of de-granulating (CD107a+) CD8+ T cells isolated from dexamethasone and control groups of animals. (M) The mean fluorescence intensities (MFI) for CD107a by CD8+ T cells from control and dexamethasone group are shown by bar diagrams. (N) Viral loads measured from the extracted footpads of sham and dexamethasone treated mice are shown by bar diagram. Mean values and ± SD are shown. In each experimental group 4–5 animals were included. The experiments were repeated with similar results. **p < 0.005; *p < 0.05 and NS (p > 0.05)- not significant (Mann-Whitney U test- two tailed).

