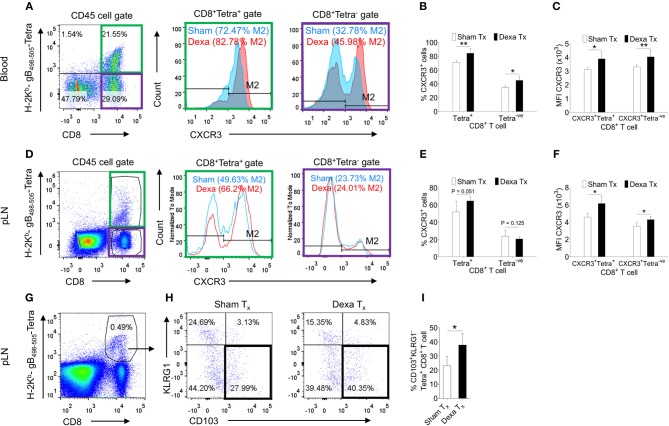
Figure 2.
Dexamethasone modulates tissue homing molecules in CD8+ T cells during HSV1 infection. C57BL/6 mice were infected with HSV1-KOS (5 × 10⁵ pfu/foot pad) and were then injected with the diluent or dexamethasone (10 mg/Kg Bwt) intraperitoneally from 4 to 6 dpi. Expression levels of CXCR3 on CD8+ T cell subsets in blood (6 dpi) and draining popliteal LNs (7 dpi) isolated from diluent and dexamethasone treated mice were measured by flow cytometry. Representative FACS plots shows CXCR3 expression on H-2Kb-gB498−505-tetramer+ve and H-2Kb-gB498−505-tetramer−veCD8+ T cells in blood circulation (A) and draining PLN (D). (B) The percentage of CXCR3+ H-2Kb- gB498−505-tetramer+ve and CXCR3+ H-2Kb- gB498−505-tetramer−ve cells is shown by bar diagrams. (C) Mean fluorescence intensities (MFI) for CXCR3 expression by H-2Kb- gB498−505-tetramer+ve and H-2Kb-gB498−505-tetramer−veCD8+ T cells are shown by bar diagrams. (E) The percentage of CXCR3+ H-2Kb-gB498−505-tetramer+ve and CXCR3+ H-2Kb- gB498−505-tetramer−ve cells is shown by bar diagrams. (F) MFI for CXCR3 on H-2Kb-gB498−505-tetramer+ve and H-2Kb-gB498−505-tetra−veCD8+ T cells are shown by bar diagrams. (G–I) The frequencies CD103+ KLRG1− T cells out of H-2Kb-gB498−505-tetramer+veCD8+ T cells in sham and dexamethasone treated mice infected with HSV1 are shown by representative FACS plots (G,H) and bar graphs (I) in the draining popliteal LNs cells. Mean ± SD are represented. The experiments were repeated two times with similar results. In each experimental group 4–6 animals were included. **p < 0.005; *p < 0.05, and NS (p > 0.05)- not significant (Unpaired t-test).

