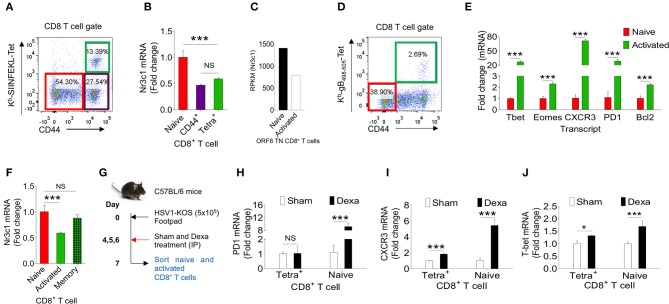
Figure 6.
Dexamethasone alters transcriptional profile of virus expanded CD8+ T cells. Different subsets of CD8+ T cells were FACS sorted from C57BL/6 mice that were transferred with 1 × 10⁵ of OT1 cells and infected intraperitoneally with MHV68-M2-SIINFEKL. Indicated cell populations were FACS sorted. (A) Sorted CD8+ T cell subsets (naïve-CD44lo; H-2Kb-SIINFEKL tetramer−veCD44hi and H-2Kb-SIINFEKL-tetra+veCD44+) from spleens of MHV68-M2-SIINFEKL infected mice. (B) Quantitative RT-PCR data for glucocorticoid receptor (nr3c1) expression in sorted CD8+ T cell subsets as shown as fold change of naïve H-2Kb-SIINFEKL tetramer+ve. (C) RPKM values of nr3c1 in naïve and activated MHV68 specific TCR transnuclear (TN) CD8+ T cells as measured by RNAseq are shown. (D,E) HSV1 expanded endogenous CD8+ T cells of indicated phenotype were FACS-sorted from the draining popliteal LNs at 7dpi of HSV1 infected mice. (D) A representative FACS plot show the sorted cell population. (E) RT-PCR was performed for measuring mRNA of indicated gene expression in naive and virus specific (H-2Kb-gB498−505-tetramer+ve) CD8+ T cell subsets activated and expanded by HSV1 infection. Relative expression as fold change for different gene is shown. (F) RT-PCR was performed for measuring the mRNA of nr3c1 gene expression in naïve, HSV1 specific (H-2Kb- gB498−505-tetramer+ve) CD8+ T cells in the acute (7 dpi) and memory stage (60 dpi) of the response in HSV1 infected mice. The fold change is shown by bar diagram. Experiments were performed with more than 3 animals at each time point. Mean and ± SD are shown. ***p ≤ 0.001, **p ≤ 0.005, *p ≤ 0.05 (Unpaired t test). (G) A schematic of the experiments to study the effect of corticosteroid on transcript expression level is shown. (H–J) Naïve and activated HSV1 specific (H-2Kb-SSIEFARL-tetramer+ve) CD8+ T cells were isolated from control and dexamethasone HSV1 infected animals (7 dpi). The expression levels PD1 (H), CXCR3 (I), and Tbet (J) were measured by quantitative RT-PCR. Bar diagrams show the relative fold change in the expression for different genes. Mean ± SD are shown. ***p < 0.001; *p < 0.05 and NS (p > 0.05)- not significant (Unpaired t-test).

