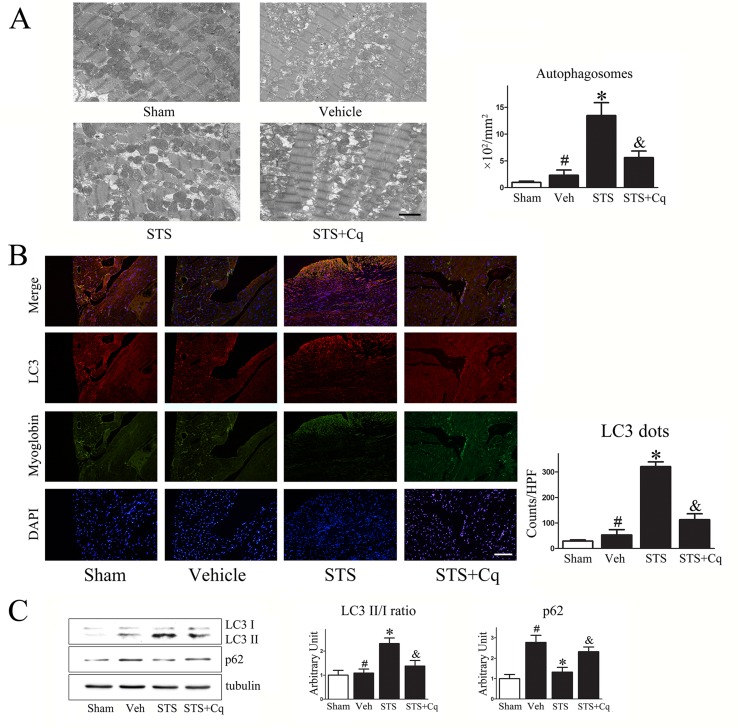
Figure 5.
Sustained activation of autophagy in hearts treated with STS. (A) Electron micrographs of autophagosomes in the ischemic border zone of heart myocardium 4 weeks after left anterior descending artery ligation. Original magnification ×5,000; (scale bars = 2 µm). Quantitative analysis of autophagosome number is shown in right panel. (B) Representative images of LC3 dots in ischemic border zone of post-MI heart; green, LC3; blue, 4′,6-diamidino-2-phenylindole-stained nuclei; red, myoglobin-positive cardiomyocytes; original magnification ×200 (scale bar = 20 µm). (C) Western blots with densitometric analysis (left panel) of autophagy-related LC3 and p62 protein expression in hearts. Graphs (right panel) show the intensity of each band in fold change: the LC3-II/LC3-I ratio and p62 expression. # P < 0.05 versus sham; *P < 0.05 versus vehicle; & P < 0.05 versus STS. Veh, vehicle; STS, sodium tanshinone IIA sulfonate; Cq, chloroquine.

