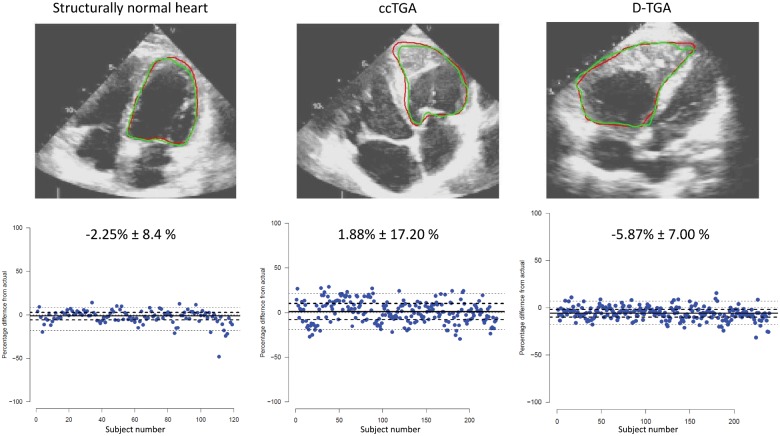
Figure 4.
Representative examples of systemic ventricular segmentation in subjects with a structurally normal heart, TGA, and ccTGA in the external test cohort (upper panel). The red line represents the manually provided ground-truth line, the green line is the automatically generated segmentation line by the deep learning algorithm. The lower panel illustrates the area variability between automatic segmentation and manually provided ground-truth mask. The values indicate mean ± standard deviation.

