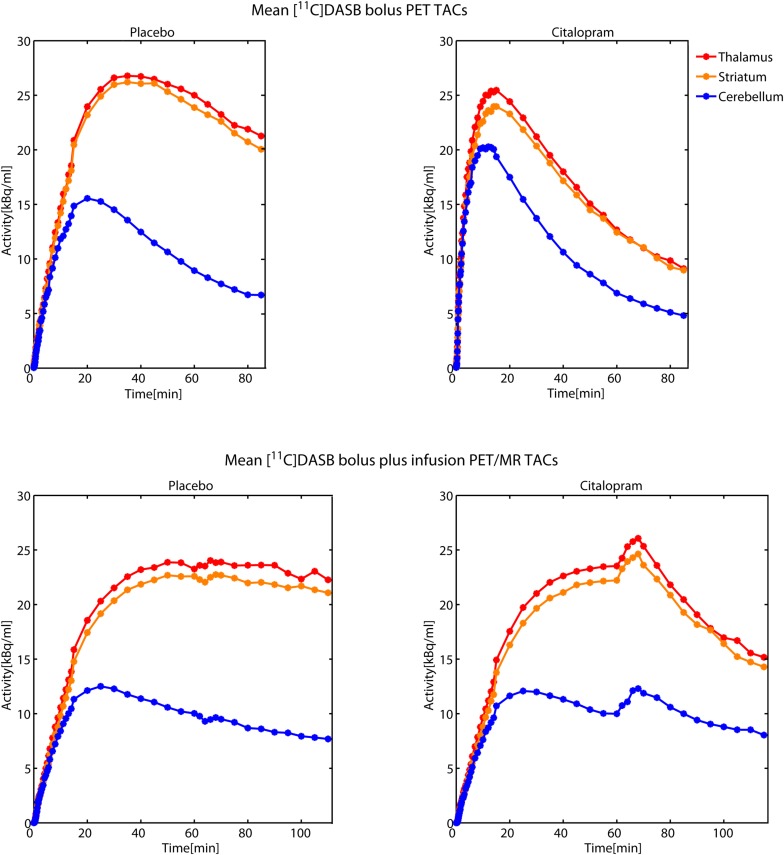
FIGURE 2.
Time activity curves (TACs) from [11C]DASB bolus PET scans (upper row) and [11C]DASB bolus plus constant infusion PET/MR scans (bottom row) during placebo (left) and citalopram condition (right) are averaged across 7 subjects each. TACs from striatum, thalamus and the cerebellum are illustrated in red, orange, and blue color, respectively. Double-blind application of the pharmacological challenge was performed 60 min after initiation of [11C]DASB bolus plus constant infusion PET/MR scans. Transient increases in tissue activity during the citalopram scans (bottom right) might be caused by peripheral displacement of the tracer from SERT rich tissues, such as the lungs.

