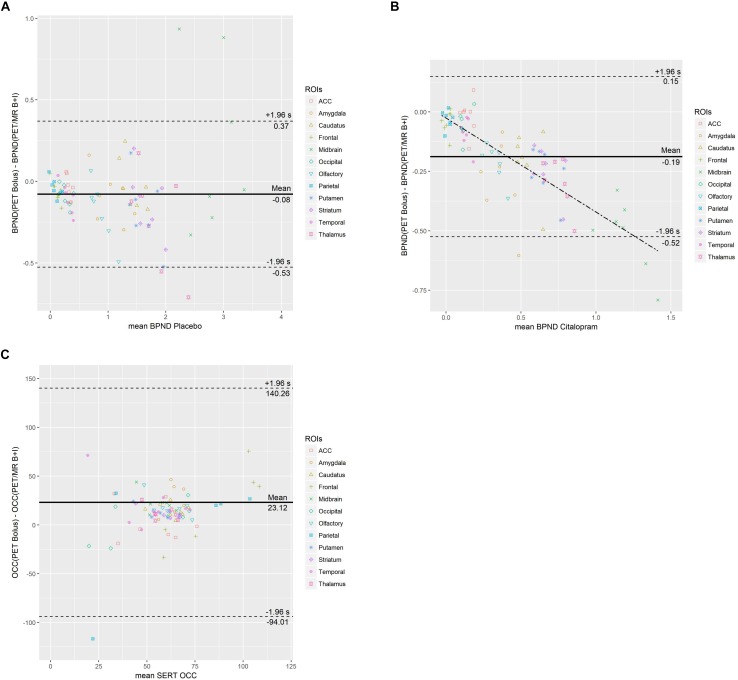
FIGURE 3.
Bland-Altman plots of difference between PET and PET/MR imaging procedures vs. the mean of the two measurements are displayed for BPND during placebo (A) and citalopram condition (B) as well as SERT occupancy (C). The mean difference (bias) is represented by the parallel solid line. Limits of agreement are represented from –1.96* SD to +1.96* SD by dotted lines. In (B) the dash-dotted line represents the regression line (y = –0.3953× – 0.0258). In (C) data points with a mean occupancy ≤120% are shown.

