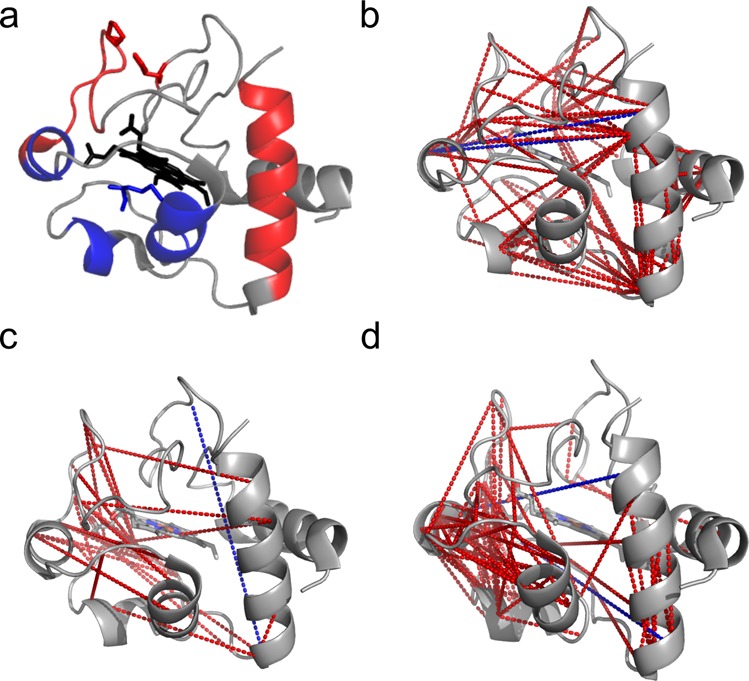
Figure 5.

Unique residue pairs matching the PDB (2b4z) crystal structure of cytochrome C. (a) Known residues, helix, and loop regions triggering alkaline and acidic conformational changes in cytochrome C (red, acidic transition; blue, alkaline transition; black, heme group). (b) Residue pairs having maximum abundance at pH ≤ 5, corresponding to the acidic form of cytochrome C (red, links below the distance limit of 25 Å; blue, links longer than 25 Å). (c) Residue pairs having maximum abundance at pH 6–7, corresponding to the neutral form (red, links below the distance limit of 25 Å; blue, links longer than 25 Å). (d) Residue pairs having maximum abundance at pH ≥ 8, corresponding to the alkaline form (red, links below the distance limit of 25 Å; blue, links longer than 25 Å).
