Figure 3.

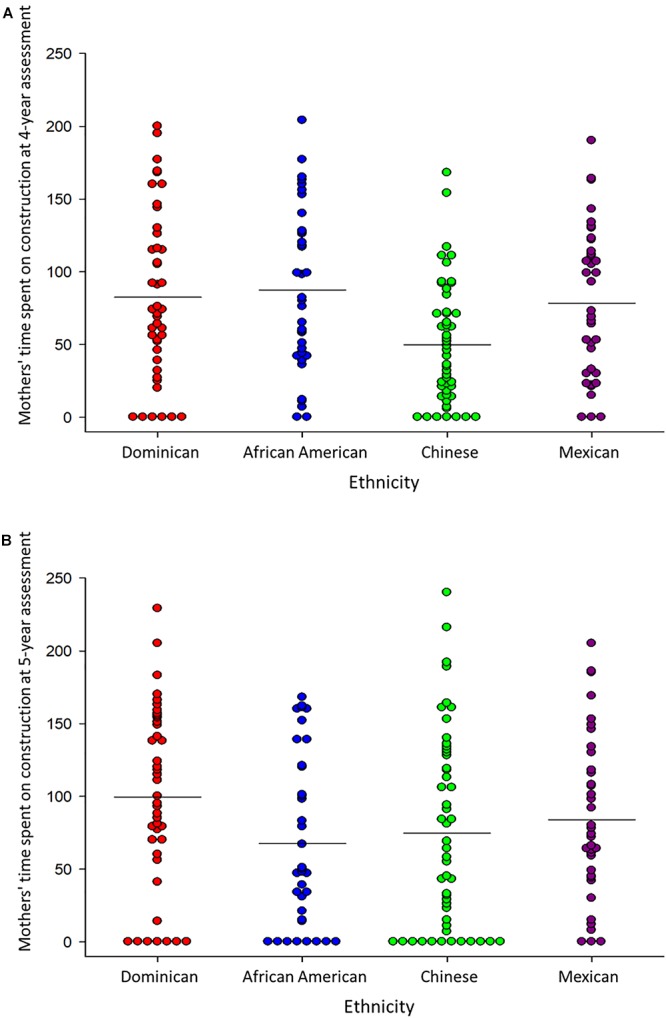
Overall time spent on construction activities by mothers from each ethnic group at the (A) 4-year assessment, and (B) 5-year assessment. Each dot represents a mother, and horizontal lines denote averages.

Overall time spent on construction activities by mothers from each ethnic group at the (A) 4-year assessment, and (B) 5-year assessment. Each dot represents a mother, and horizontal lines denote averages.