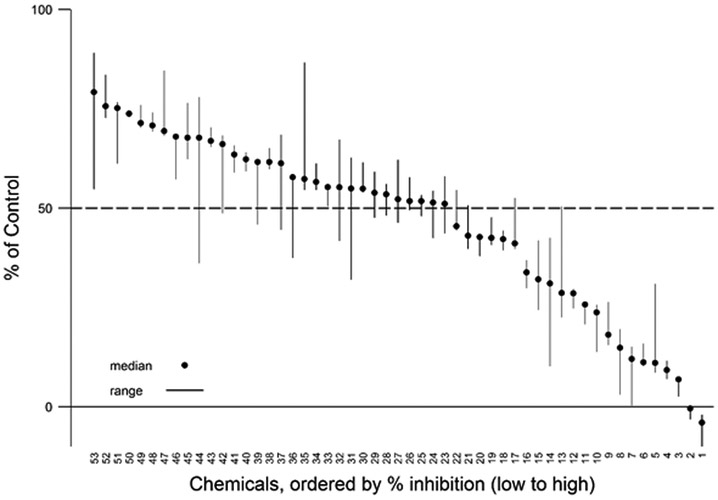
Figure 4.
Expanded plot of chemicals with >20% inhibition. Plot of the % inhibition of DIO1 (median and range; n=3) for those 53 chemicals that produced >20% inhibition when initially screened at a single concentration (200 μM), includes 48 TCp1_v2 chemicals and 5 internally sourced chemicals. Chemicals are plotted by rank order with those producing the greatest inhibition to the right. The numbers on the x-axis correspond to the specific chemicals. Those with greater than 50% inhibition are shown in Table 3. Those with less than 50% inhibition can be found in Supplemental Table 1 along with all other chemicals.

