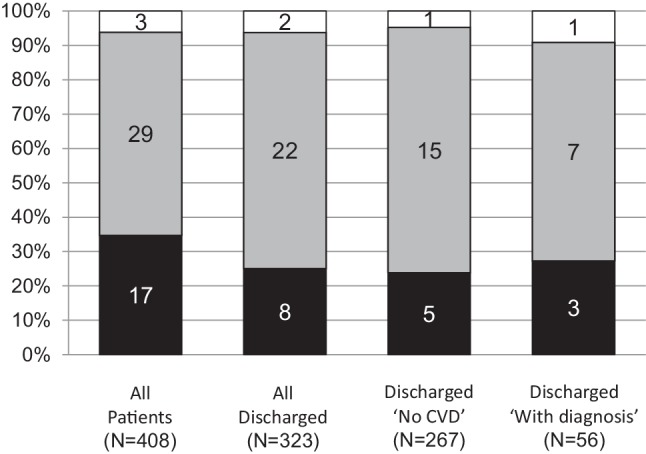
Fig. 4.

Causes of death during 10-year follow-up presented in percentage. In columns the absolute numbers are given (cardiac = black, non-cardiac = grey, unknown = white column) for all patients, all discharged patients, discharged with ‘No CVD’ and discharged with a diagnosis. ‘No CVD’ no cardiovascular disease
