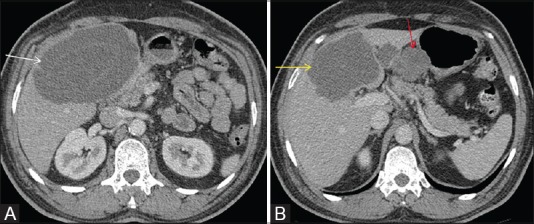
Figure 13 (A and B).

In this case of gastric GIST, axial post contrast CT scan shows a large hypoattenuating metastatic liver lesion (white arrow in A). Post chemotherapy, there is decrease in size as well as attenuation of the liver metastatic lesion (yellow arrow in B). Residual gastric GIST is also seen (red arrow in B; not shown in Figure A)
