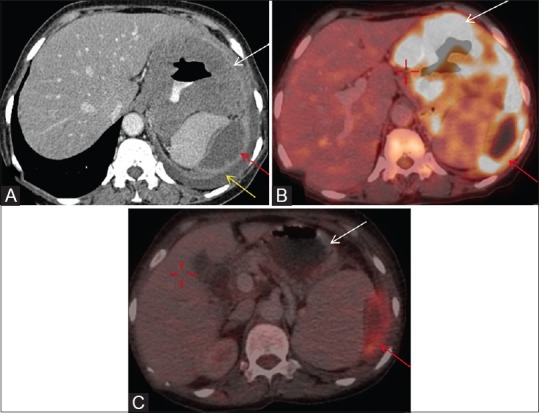
Figure 14 (A and B).

(A) Axial post contrast CT image shows homogeneous wall thickening involving body of stomach (white arrow). Peripherally enhancing cystic/necrotic peritoneal deposit is also seen in left hypochondriac region (red arrow). Left pleural effusion is also seen (yellow arrow). (B) FDG PET/CT fused axial image shows intense FDG uptake in gastric GIST (white arrow). There is also peripheral FDG uptake in peritoneal deposit (red arrow). Central non FDG avid area is cystic/necrotic. (C) Post imatinib, there is no FDG uptake in gastric mass (white arrow) and interval decrease in size and FDG uptake (SUV less than 2.5) in peritoneal deposit (red arrow) suggestive response to imatinib
