Fig. 4.
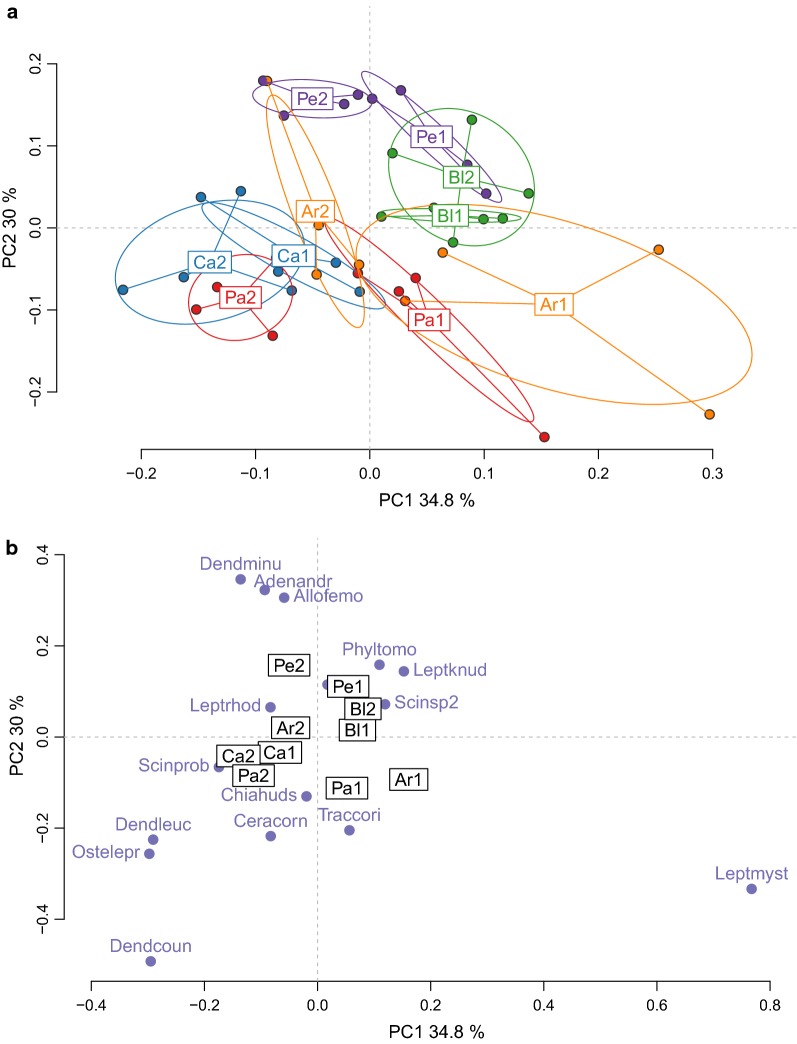
Diversity of the species composition in explosive breeding events across sites. The two principal axes (64.8% of variance explained) of the crossed DPCoA analysis are plotted. a Diversity between and within communities. Each point is a community. The communities were color-coded with the levels of the factor event. Code names for events are: Ar = Arlesienne, Bl = Blanc, Ca = Caïman, Pa = Patawa, Pe = Petite. The number that follows the code name distinguishes the explosive breeding event in each site, for instance Ar1 is for the first event on site Arlesienne, and Ar2 is for the second event on the same site. b Coordinates of the constitutive species in the axes. Each point is a species. Only the species that had the highest values on the axes were named. Code names for the species are: Adenomera andreae = Adenandr, Allobates femoralis = Allofemo, Ceratophrys cornuta = Ceracorn, Chiasmocleis hudsoni = Chiahuds, Dendropsophus counani = Dendcoun, Dendropsophus leucophyllatus = Dendleuc, Dendropsophus minutus = Dendminu, Leptodactylus knudseni = Leptknud, Leptodactylus mystaceus = Leptmyst, Leptodactylus rhodomystax = Leptrhod, Osteocephalus leprieurii = Ostelepr, Phyllomedusa tomopterna = Phyltomo, Scinax sp2 = Scinsp2, Trachycephalus coriaceus = Traccori

