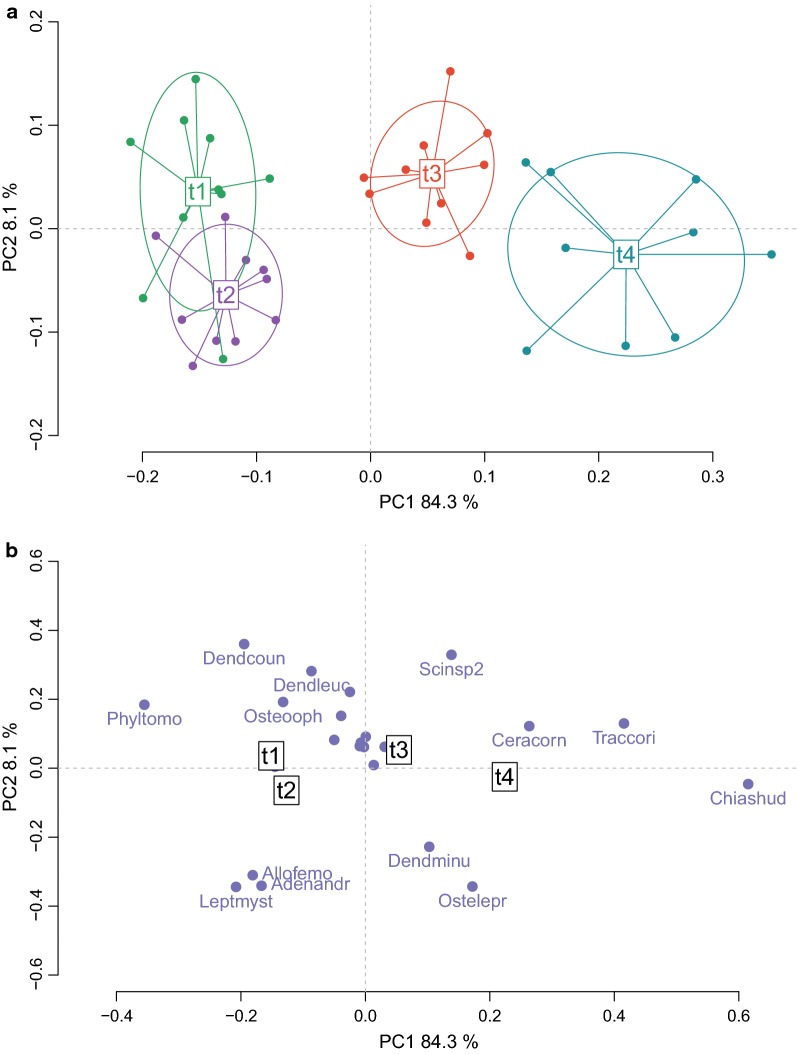
Fig. 5.
Diversity of the species composition in explosive breeding events across time. The two principal axes (92.4% of variance explained) of the crossed DPCoA analysis are plotted. a Diversity between and within communities along the time. Each point is a community. The communities are color-coded with the levels of factor time: t1, t2, t3, and t4. Pre-explosive and mid-explosive communities are clearly discriminated along the first axis. b Coordinates of the constitutive species in the axes. Each point is a species. Only the species that had the highest values on the axes were named: Adenomera andreae = Adenandr, Allobates femoralis = Allofemo, Ceratophrys cornuta = Ceracorn, Chiasmocleis shudikarensis = Chiashud, Dendropsophus counani = Dendcoun, Dendropsophus leucophyllatus = Dendleuc, Dendropsophus minutus = Dendminu, Leptodactylus mystaceus = Leptmyst, Osteocephalus leprieurii = Ostelepr, Osteocephalus oophagus = Osteooph, Phyllomedusa tomopterna = Phyltomo, Scinax sp2 = Scinsp2, Trachycephalus coriaceus = Traccori

