
Figure 2.
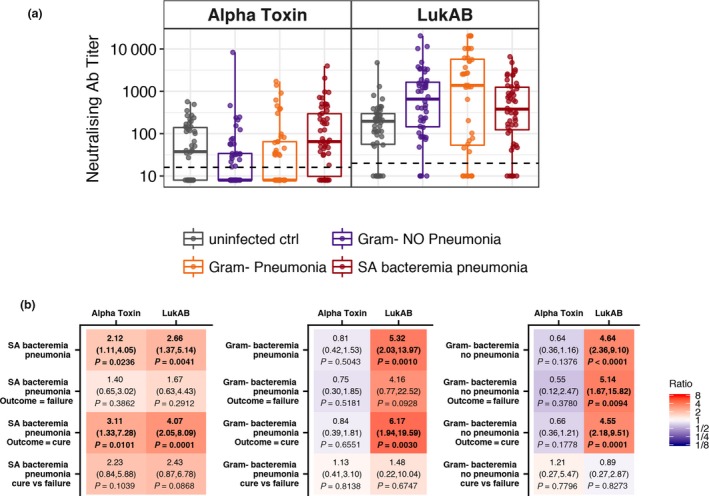
Serum anti‐AT and anti‐LukAB NAb levels. (a) A box plot is presented for each cohort and is overlaid with values from individual subjects. The dashed line represents the assay's LLOQ. Values below the LLOQ were imputed with LLOQ/2. Each sample was tested in duplicate. (b) Ratios of geometric mean level of anti‐AT and anti‐LukAB NAbs for each cohort relative to the uninfected control group and clinical outcome relative to uninfected control group and cure versus failure, with 95% CIs and P‐values. Fill colours ranging from purple to red represent lower to higher compared with the uninfected control group.