FIGURE 2.

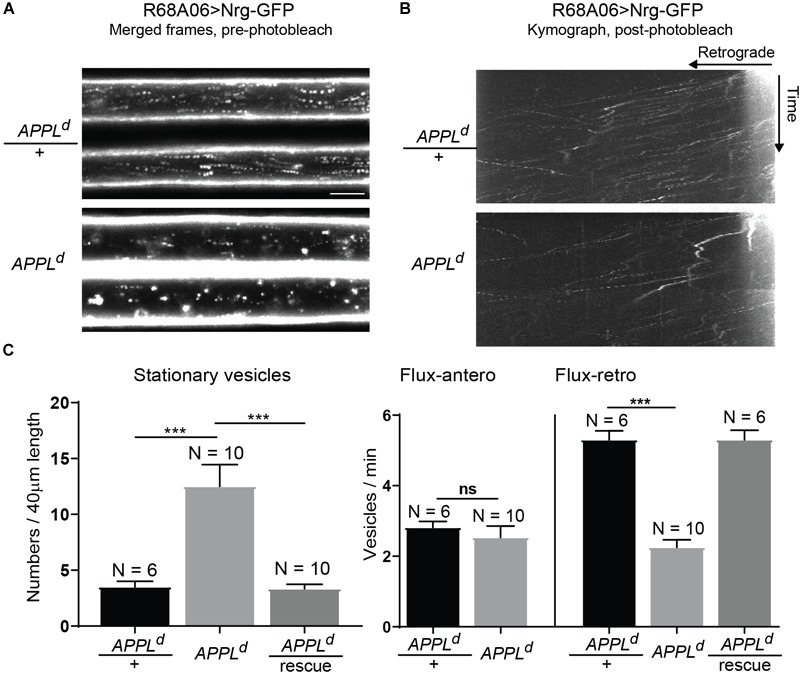
Neuroglian axonal trafficking in APPL loss of function mutants. (A) Merged frames of live recordings without photobleaching (Supplementary Videos S2, S3). Moving vesicles produce a “motion-streak,” which is more abundantly seen in wildtype animals than in APPLd null mutants. Videos were obtained at one frame per second. Scale bar represents 5 μm. (B) Kymographs of axonal transport of Nrg-GFP vesicles in control animals (APPLd/+) and APPLd mutants (Supplementary Videos S4, S5). A small section of the GF axon was photobleached to reduce background from Nrg labeling at the axonal membrane, allowing the visualization of vesicles that enter the bleached region. Videos were obtained at one frame per second. (C) Quantification of Nrg-GFP vesicle trafficking in wildtype controls (APPLd/+), APPLd as well as in APPLd rescue animals (UAS-Nrg-GFP co-expressed with UAS-APPL in APPLd background using R68A06 Gal4-line). Numbers of stationary vesicles, and numbers of vesicles moving in anterograde and retrograde direction (Flux) were analyzed. N indicates numbers of axons assessed. Error bars represents standard error mean. Statistical significance between genotypes was assessed using Student’s t-test (∗p ≤ 0.05, ∗∗p < 0.01, ∗∗∗p < 0.001, ns – non-significant, p > 0.05).
