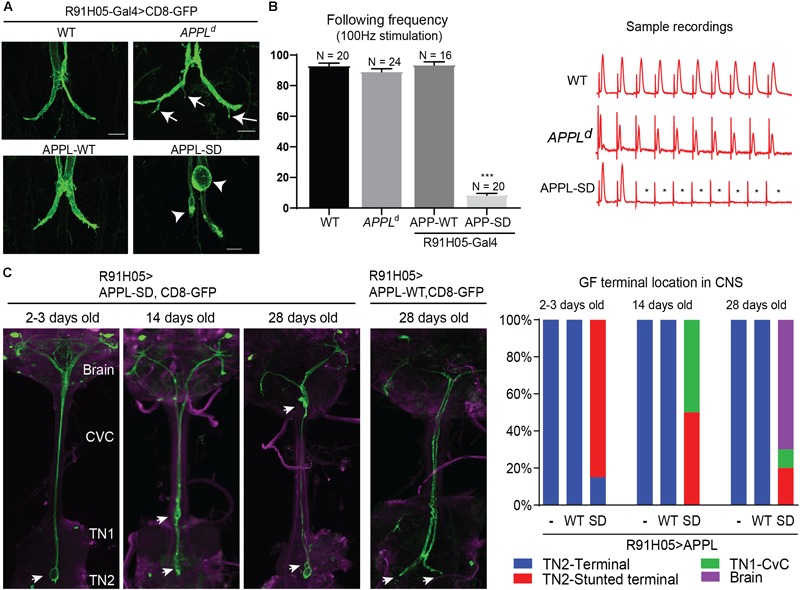
FIGURE 4.

Morphological GF terminal phenotypes in APPL gain and loss of function mutants. (A) GF terminal morphology of controls (WT), APPLd null mutants and animals overexpressing wildtype (APPL-WT) and secretion-deficient (APPL-SD) APPL throughout GF development. Terminal pruning defects are labeled by arrows. Stunted terminals or GFs with retraction bulbs are labeled by arrowheads. Scale bars represent 20 μm. (B) Functional defects of controls (WT), APPLd null mutants and animals overexpressing wildtype (APPL-WT) and secretive defective (APPL-SD) APP with the R91H05 Gal4-line. The function of GF to TTMn synapse was determined by quantifying the average number of responses from 10 trains of 10 GF stimulations given at 100 Hz. Quantification is shown in the graph on the left. N indicates numbers of GF-TTMn connections assessed per genotype. Error bars represents standard error mean. Statistical significance between genotypes was assessed using Student’s t-test (∗∗∗p < 0.001). Samples traces of electrophysiological recordings of one train are shown on the right. ∗ mark absent responses. (C) GF terminal localization in young and aged animals overexpressing wildtype (APPL-WT) and secretion-deficient (APPL-SD) APP. GFs were labeled by co-expression of CD8-GFP. In the left panels the GF terminal localization in the target area (TN2, second thoracic neuromere), first thoracic neuromere (TN1), cervical connective (CvC) or the brain are indicated by arrows. Quantification of GF terminal localization in young and aged animals are shown in the right graphs. Ten or more GFs were assessed for each genotype and time point.
