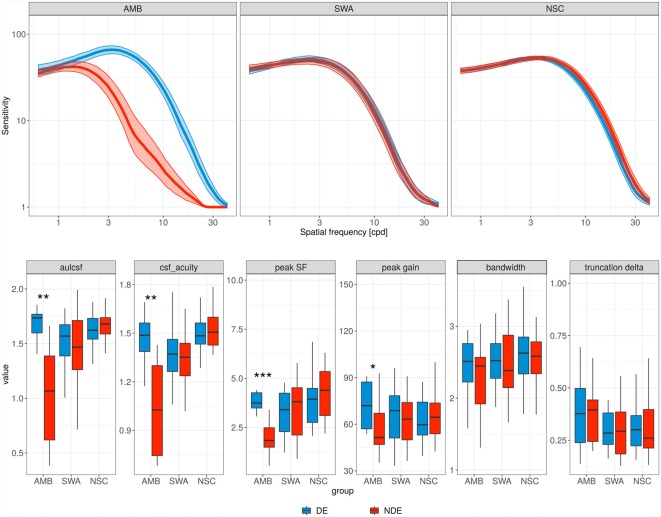
Figure 1.
Contrast sensitivity functions (CSFs). Top row, each panel contains the mean CSF of the non-dominant eye (red curve) and the dominant eye (blue curve) for the different subject groups. AMB, amblyopia; SWA, strabismus without amblyopia; NSC, normally sighted controls. Shaded areas represent ±1 standard error of the mean (SEM). Bottom row, parameter distributions of the observed CSFs. Boxplot midlines indicate median values; “*”, “**,” and “***” denote statistical significance (two-sided Wilcoxon test) at the alpha level of 0.05, 0.01 and 0.001, respectively.

