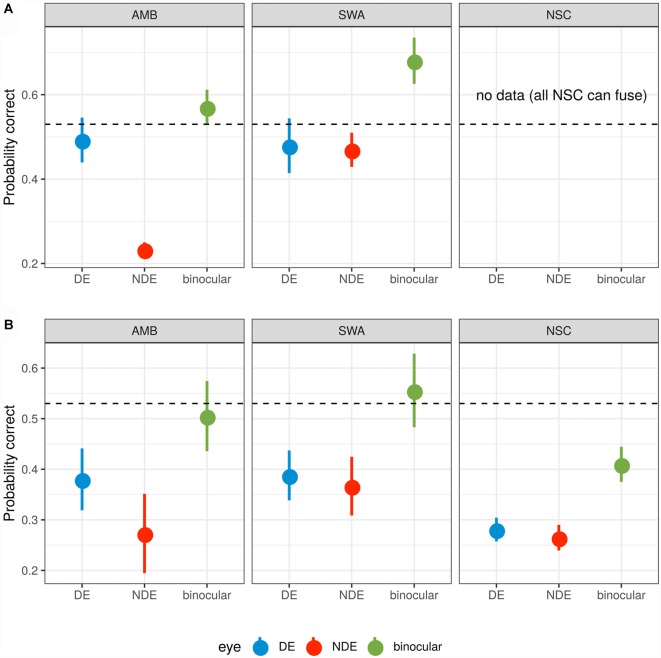
Figure 3.
Probability summation. (A) Subjects who were unable to fuse the two monocular images. (B) Subjects who were able to fuse. The dotted line indicates 53% threshold for binocular target identification. For the average contrast needed to reach this binocular threshold, monocular detection probabilities are shown for the non-dominant (red) and the dominant (blue) eye. Based on probabilistic summation of each eye’s target detection probability, the expected probability for the binocular condition is shown in green. A value below the dotted line indicates that actual binocular summation exceeds probabilistic summation. A value above the dotted line indicates that the monocular images inhibit one another so that performance is worse than expected from target detection by independent monocular mechanisms. Error bars represent ±1 SEM.

