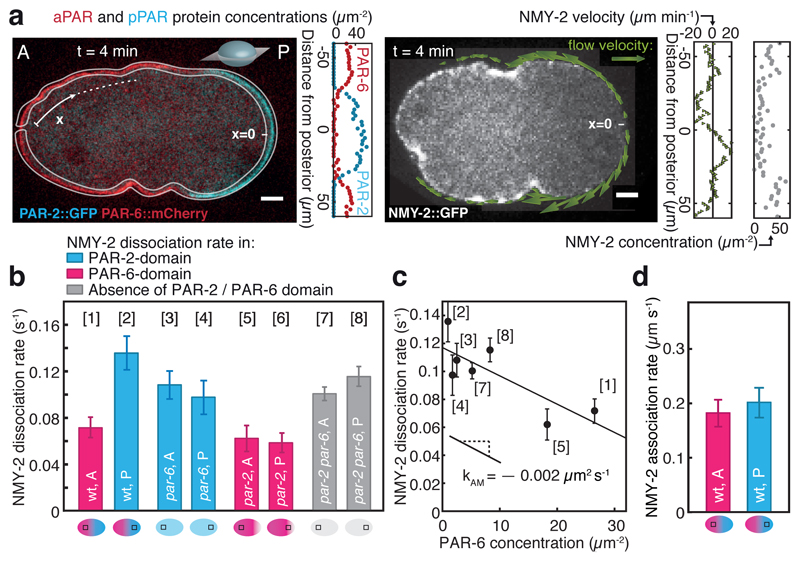
Fig. 1. Mechanochemical feedback in PAR polarity establishment.
a, Example of PAR and myosin protein concentration and velocity fields obtained at a single time point during polarity establishment from confocal medial sections using MACE (4 minutes after flow onset; blue, PAR-2::GFP representing pPARs; red, PAR-6::mCherry representing aPARs; grey, NMY-2::GFP; see Methods). Scale bar, 5 µm. A and P denote the anterior and posterior, respectively. x indicates the position along the circumference, with the posterior pole at x = 0. b, Average NMY-2 dissociation rates as measured by FRAP for unperturbed, par-2, par-6 and par-2 / par-6 double RNAi embryos as a function of position and cortical PAR state (see schematics at the bottom); see Supplementary Fig. 2d-g for statistics. c, NMY-2 dissociation rates as a function of PAR-6 concentration. Solid line represents a linear fit with slope kAM = -0.002 ± 0.0007 µm2 s−1 and intercept koff,M = 0.117 ± 0.009 s−1. Due to uncertainties in the determining the PAR-6 concentration, condition [6] (par-2 RNAi, posterior side) was not included (Supplementary Fig. 2h). d, NMY-2 association rates as a function of position and cortical PAR state (see schematics at the bottom). Error bars are standard error of the mean.

