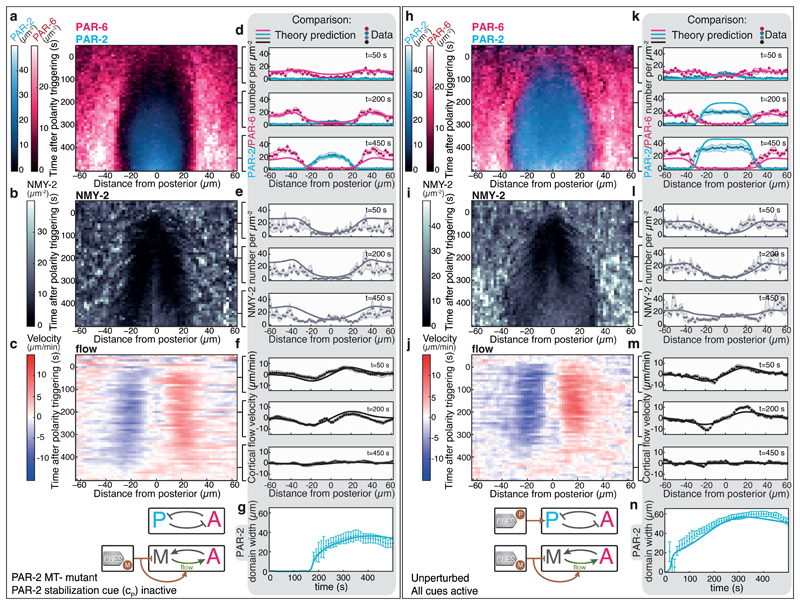
Fig. 3. Predicting PAR and myosin dynamics in the presence of guiding cues and feedback structures.
a-c, Average spatiotemporal distributions of a, aPARs (PAR-6::mCherry) and pPARs (PAR-2::GFP) (both N = 9 embryos), b, myosin (NMY-2::mKate2; N = 6 embryos) together with c, the myosin flow field (N = 9 embryos) during polarity establishment for the PAR-2 MT-mutant. d-f, Comparison of MACE data for the PAR-2 MT-mutant (dots, shaded regions represent standard error of the mean) to theory predictions (displayed at t = 50 s, 200 s and 450 s; see Supplementary Video 3). h-j, Average spatiotemporal distributions of h, aPARs (PAR-6::mCherry) and pPARs (PAR-2::GFP) (both N = 6 embryos), i, myosin (NMY-2::GFP; N = 8 embryos) together with j, the myosin flow field (N = 12 embryos) during polarity establishment of the unperturbed condition. k-m, Comparison of MACE data for the unperturbed condition (dots, shaded regions represent standard error of the mean) to theory predictions (displayed at t = 50 s, 200 s and 450 s; solid lines); see Supplementary Video 4. g,n, Comparison of the measured and predicted PAR-2 domain width for the unperturbed condition (n) and the PAR-2 MT-mutant (g). Error bars are standard error of the mean.

