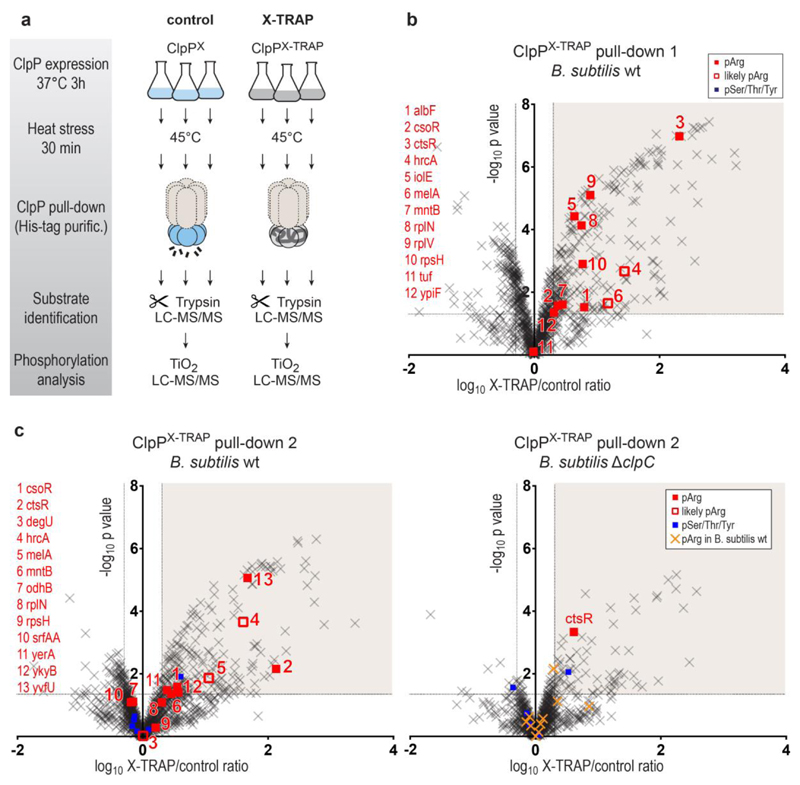
Figure 1. Pull-down of ClpP trapping mutants.
a, Cartoon illustrating the experimental workflow. As indicated, all pull-down experiments were done in triplicates. LC–MS/MS, liquid chromatography tandem mass spectrometry. b, Volcano plot illustrating proteins identified in ClpPX (control) and ClpPX-TRAP pull-downs after expression in a B. subtilis wild-type (WT) strain. Proteins were considered as ClpP substrates (shaded area) when the X-TRAP/control relative protein intensity (x axis) was >2 and the corresponding limma P value (y axis) was <0.05. Phosphorylated proteins are shown as filled squares (red: pArg, blue: pSer/Thr/Tyr). In a few cases, the phosphorylated residue could not be unambiguously localized. As the same phosphopeptides have been observed to contain a pArg in previous experiments, they are labelled as probable pArg (open red squares). Identified pArg proteins are listed on the left. c, Volcano plots of the ClpP pull-downs performed in B. subtilis wild-type and ΔclpC strains in parallel. For comparison, pArg proteins identified in the B. subtilis wild-type pull-downs are marked in yellow/orange in the ΔclpC plot.

