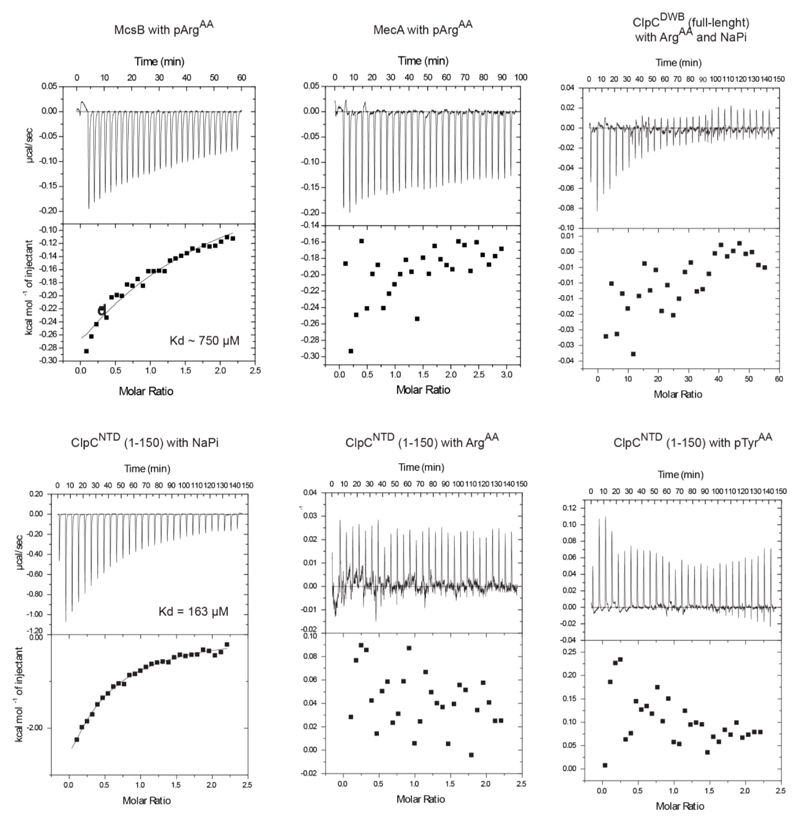
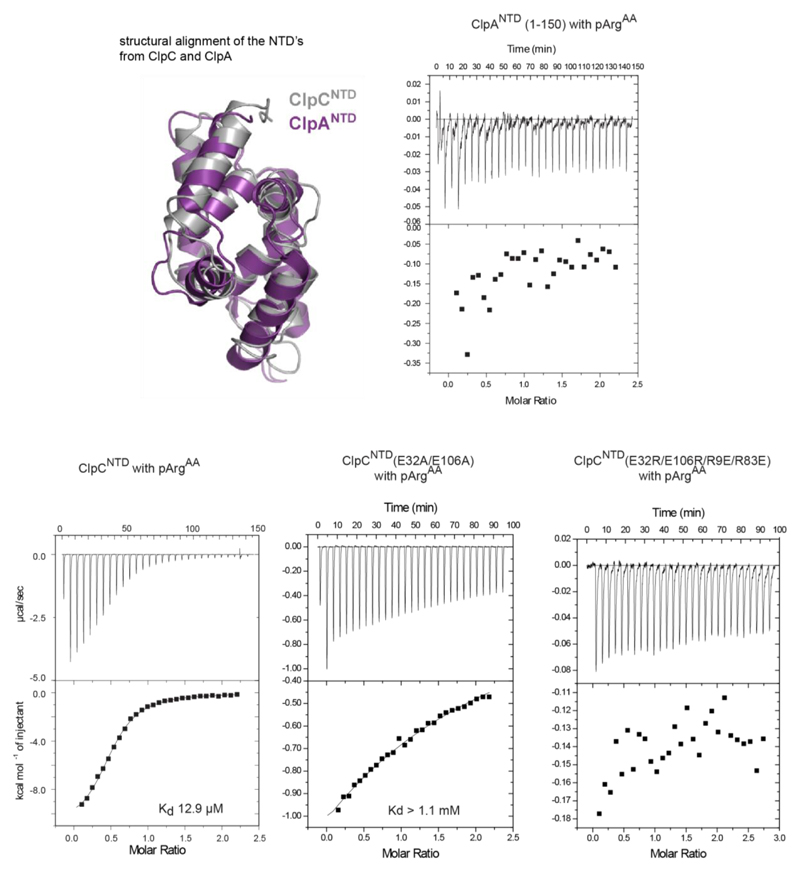
Extended Data Figure 4. ITC binding data.
For each binding study, the analysed interactions are indicated on the top, and the respective Kd values, when detected, are shown below. For reference, a structural alignment of the ClpC (grey) and ClpA (purple; PDB code 1K6K) NTDs, showing a high degree of structural similarity, is presented.


