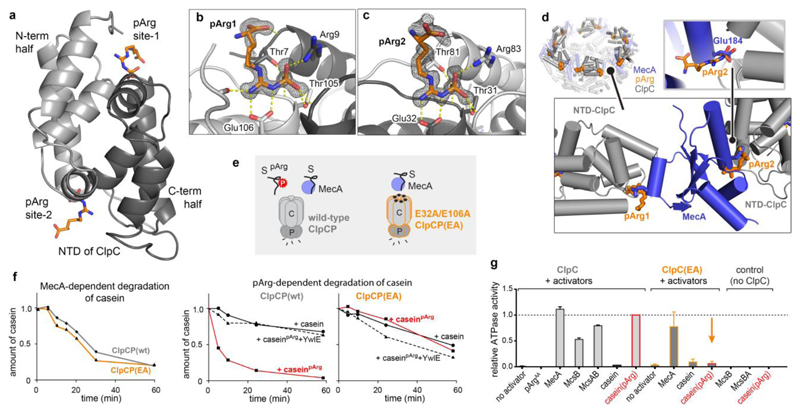
Figure 5. Crystal structure of the ClpC NTD in complex with pArg.
a, Overall structure of the ClpC NTD domain bound to two pArgAA molecules. The cartoon representation is coloured in light grey (residues 70–148) and dark grey (4–69) to highlight the two symmetrical halves of the NTD. b, c, Zoomed view of pArg-binding sites 1 (b) and 2 (c), with labelled interacting residues. The 2Fo – Fc omit electron densities of the pArgAA ligands, calculated at 1.6 Å resolution, are contoured at 1σ. d, Overlap of MecA- and pArg-binding sites. Shown is the hexameric organization of the ClpC1–485 (grey) complex with MecA121–218 (blue) (PDB code 3PXG; ref. 29) superimposed with pArgAA (orange). Bottom left, zoomed-in view shows two adjacent ClpC NTDs with pArgAA and MecA interactors. Bottom right, zoomed-in view illustrates that the pArg phosphoryl group and Glu184 (Glu198 in second binding site) of MecA compete for the same ClpC binding pocket. e, Scheme representing the distinct substrate (S) preferences of the wild-type ClpCP and ClpCPEA protease complexes. f, Degradation assays comparing the activity of wild-type ClpCP and ClpCPEA towards MecA-delivered (left) and pArg-labelled (middle, right) casein. YwlE was used as a control for the pArg-dependent degradation. g, ATPase activity of ClpC and ClpCEA in the presence of putative substrate proteins. Levels are normalized to the induced ATPase activity of the ClpC–caseinpArg complex. Error bars show the s.d. of three independent experiments.

