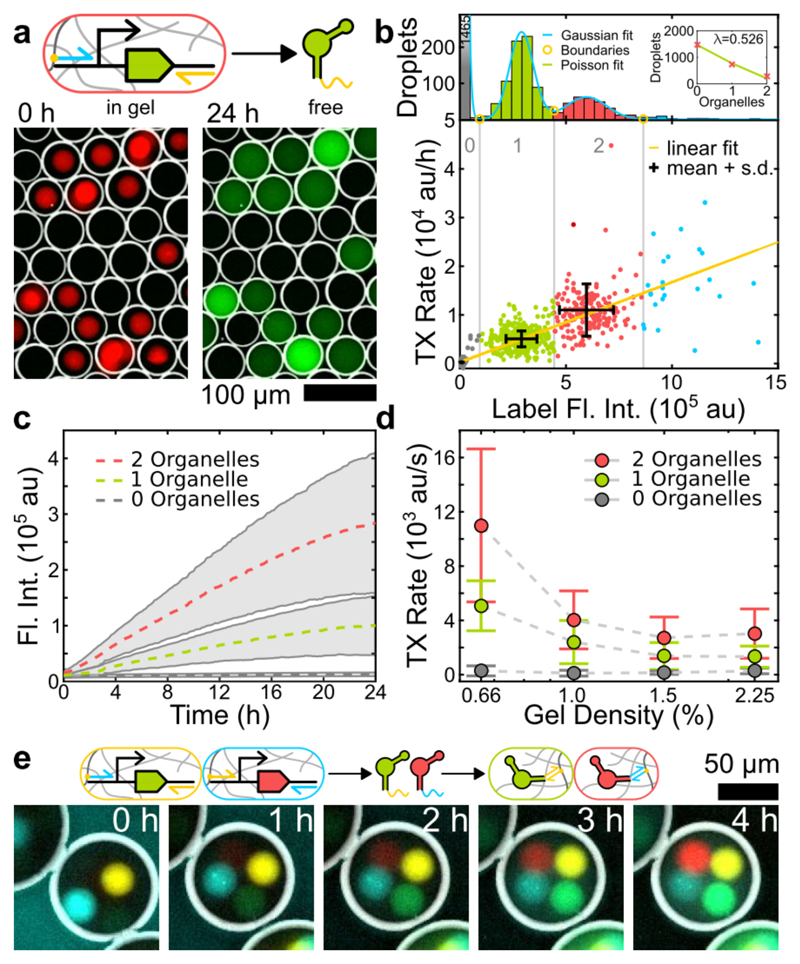
Figure 2.
a) Fluorescence false color, inverted bright field (BF) overlay images of droplets containing 1-3 Cy5 labelled transcription organelles (red) producing dB RNA (green) that distributes in solution. b) Droplets were clustered by fitting a sum of Gaussians to the distribution of the label intensity (top). The number of organelles per droplet roughly follows a Poisson distribution (inset). The rate is proportional to the number of sender spheres. c) Average time traces showing the total dB fluorescence corresponding to the populations in b). d) Transcription rate increases with decreasing gel density. Data shown in b) and c) corresponds to 0.66% gel density. All error bars and shaded areas represent standard deviations. e) Fluorescence overlay time series showing the transcription of RNA from dB (yellow) and MG (cyan) transcription organelles and orthogonal RNA localization in dB (green) and MG (red) capture organelles.

