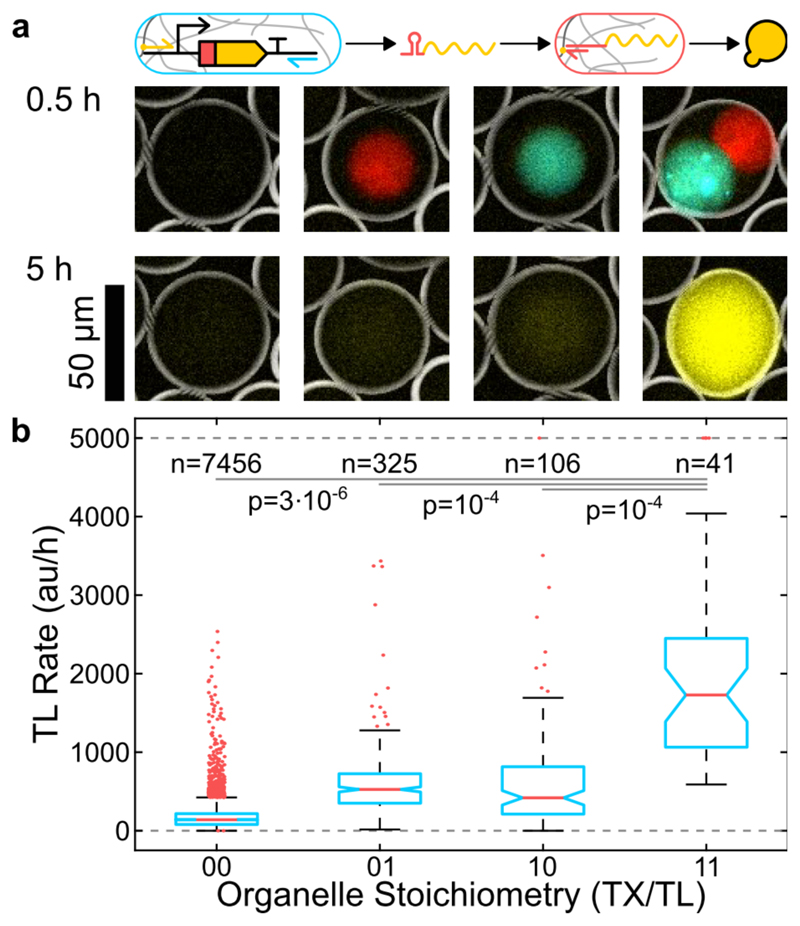
Figure 4.
Combination of localized transcription and localized translation. a) Inverted BF, fluorescence overlay images showing transcription (cyan) and translation organelles (red) after 0.5 and the reporter protein (yellow) after 5 hours. b) Boxplots illustrating the reporter expression rate for different organelle content as shown in a). Boxes are 25% and 75% percentiles, notches are 95% confidence intervals, outliers were clipped at 5000 au/h.

