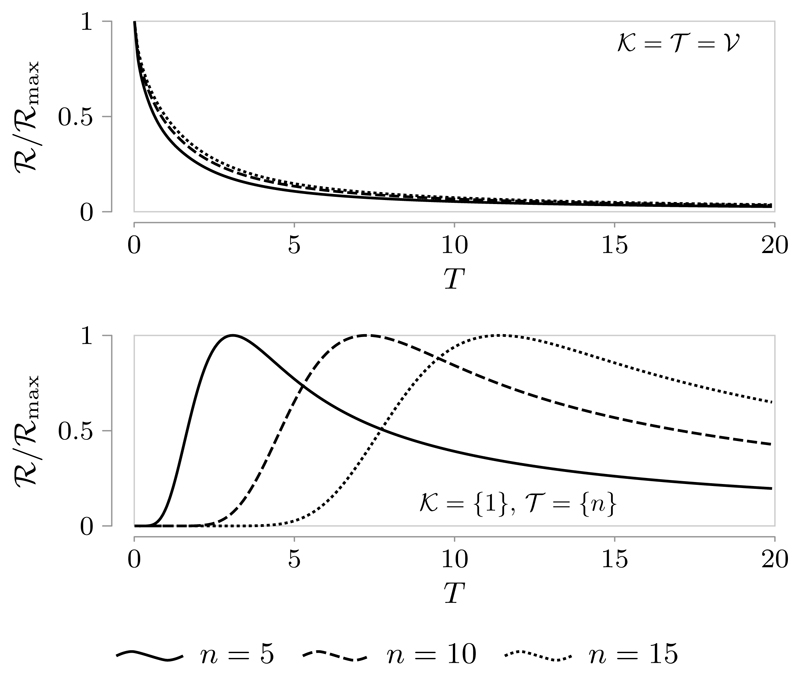
Fig. 3.
Normalized plots of ℛ against transmission time T for the line network in (16) with SNR = 1, α = 1, β = 1, and γ = 2.5. Top plot: 𝒦 = 𝒯 = 𝒱. Bottom plot: 𝒦 = {1}, 𝒦 = {n}. Notice that the curves obtained for 𝒦 = 𝒯 = 𝒱 coincides (up to a normalization factor) with the ones of the scalar case in Fig. 2, after replacing a with −tr A.

