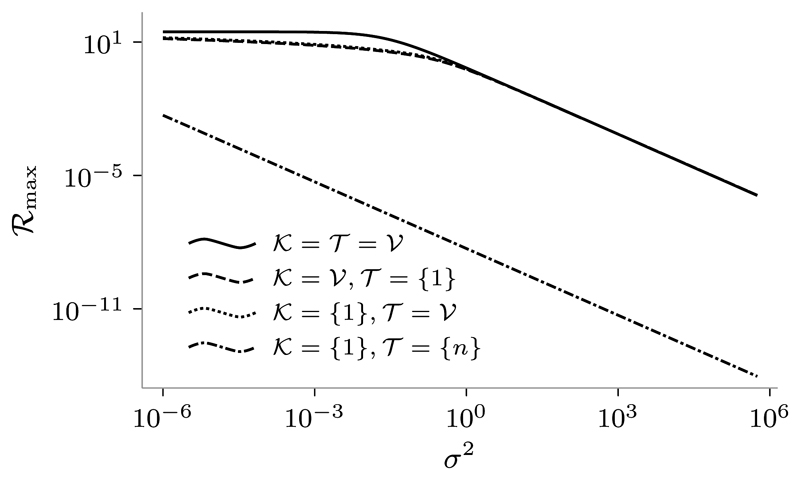
Fig. 4.
Logarithmic plot of ℛmax against σ2 for P = 1 and different choices of 𝒦 and 𝒯 for the line network in (16) with n = 8, α = 1, β = 1 and γ = 2.5. The curves obtained for 𝒦 = 𝒱, 𝒯 = {1} (dashed line) and 𝒦 = {1}, 𝒯 = 𝒱 (dotted line) are almost overlapping.

