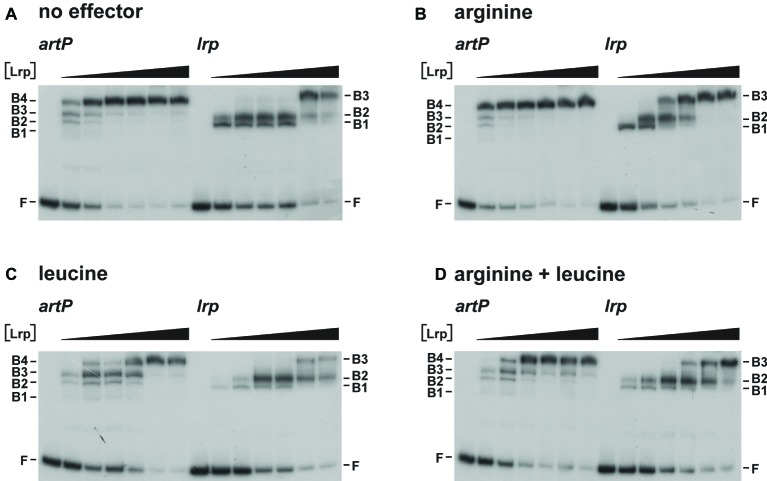
Figure 4.
Representative autoradiographs of Lrp binding to the artP and lrp control regions in the absence (A) and in the presence of 10 mM l-arginine (B), 10 mM l-leucine (C) or 10 mM of both (D), as indicated. Lrp concentrations (black colored triangle) correspond to 0, 0.23, 0.46, 0.92, 1.84, 3.68, and 7.36 μM (expressed in monomer equivalents). The position of the free DNA fragments (F) and the Lrp-bound DNA fragments (B1, B2, B3) are indicated.

