Figure 6.
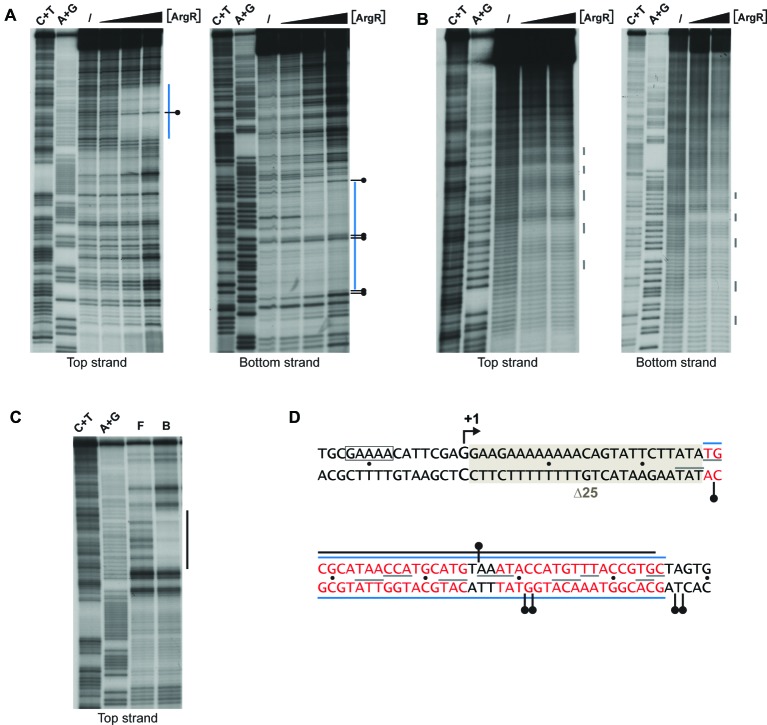
Enzymatic and chemical footprinting of ArgR binding to the lrp control region. (A) DNase I footprinting. A blue bar represents the zone of protection. A short horizontal bar with a dot represents a site that becomes hyperreactive to DNase I cleavage upon ArgR binding. ArgR concentrations used are 0, 0.39, 3.91, and 39.1 nM. C + T and A + G correspond to the Maxam-Gilbert sequencing reactions. (B) Hydroxyl radical footprinting. ArgR concentrations used are 0, 39.1 and 78.3 nM. Short gray colored vertical lines represent sites of protection. (C) In gel footprinting with the [(OP)2-Cu+] ion. F and B correspond to free and ArgR-bound DNA recovered from gel after treatment with the [(OP)2-Cu+] ion. (D) Nucleotide sequence with indication of zones of protection. Symbols are as in panels A, B and C. Red colored letters represent the 18 bp ARG boxes. The −10 promoter element is boxed. The 25-bp deletion of mutant ∆25 used for reporter gene assays (Figure 8) is gray shaded. The Lrp binding site as defined by DNase I footprinting (Wang et al., 1994) extends from position −106 to −20 and is not included in this figure.

