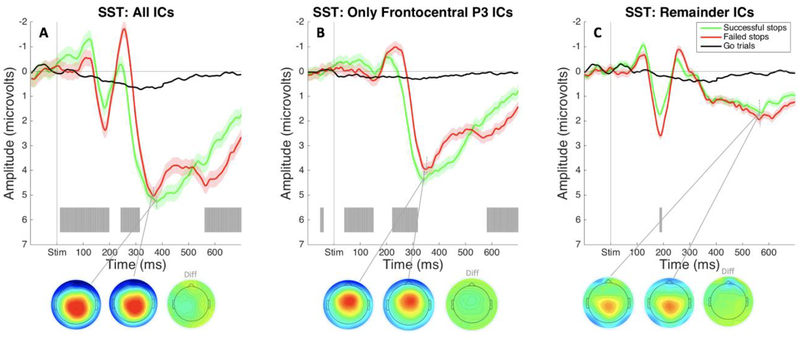
Figure 3.
ERPs from the SST in Study 1 time-locked to stop-signal onset and plotted over average of Cz and FCz electrodes. Gray shading indicates significant differences between successful and failed stop trials (FDR corrected at p <. 05). A) ERPs and P3 peak topography for failed and successful stop trials plotted during the same time range on matched go trials. B) ERPs and peak P3 topography for successful and failed stop trials and matched-go trials plotted using only the selected Frontocentral P3 IC. C) ERPs and peak P3 topography for successful and failed stop trials and matched-go trials plotted using all independent components besides the selected Frontocentral P3 IC.

