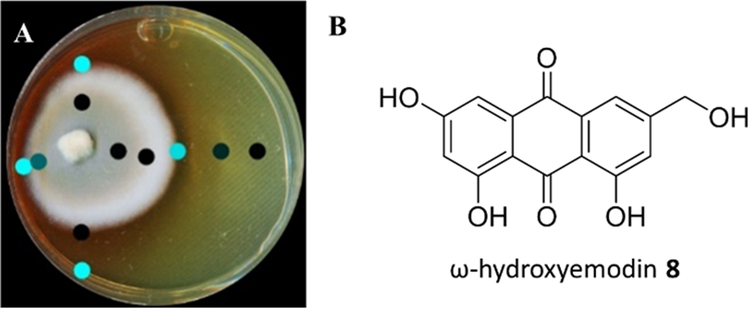
Fig. 7.
(A) An inoculum of P. restrictum was placed to the side of a Petri dish of Sabouraud dextrose agar, rather than the traditional center, so as to visualize the spread of the compound as it is exuded into the media. The dots show where the chemistry was analysed in situ. The teal color represents higher amounts of ω-hydroxyemodin, as detected via droplet probe analysis; black spots represent less or the absence of ω-hydroxyemodin. (B) structure of ω-hydroxyemodin.

