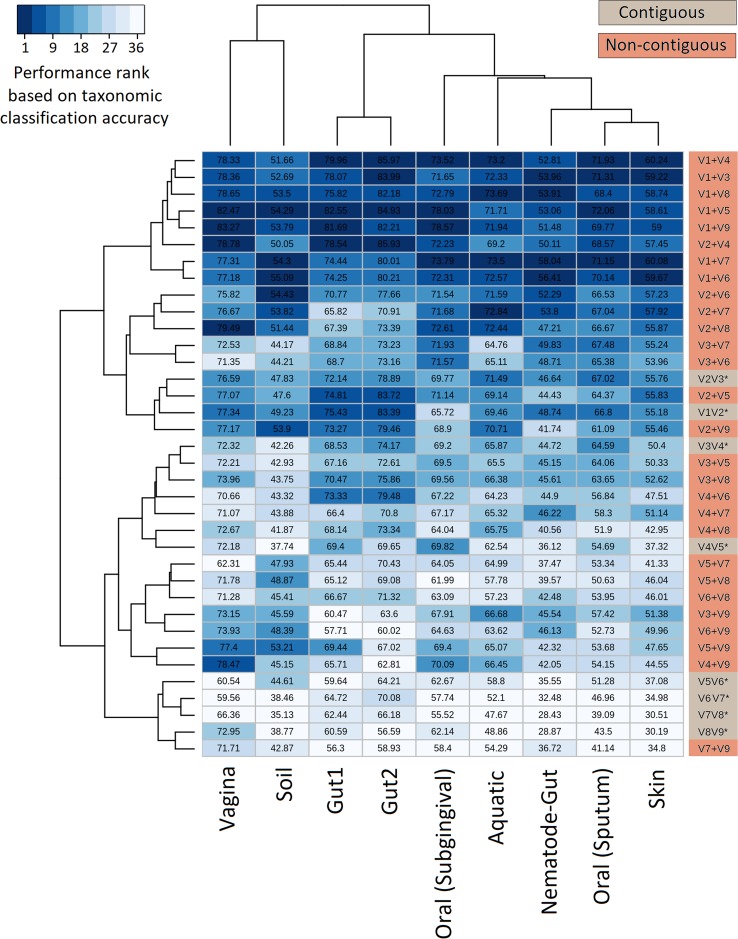
Figure 5.
Evaluation of taxonomic classification efficiency on simulated microbiomes. Taxonomic classification efficiency of different combinations of V-regions evaluated on nine simulated microbiome datasets mimicking different environmental niches. Taxonomic classification accuracy in terms of percentages of correct assignments at species level are indicated in the heatmap. The color scale (1–36) depicts the performance rank of different combinations of V-regions (total of 36 combinations) in terms of taxonomic classification accuracy for each of the simulated microbiomes (presented in columns).

