Figure 2.
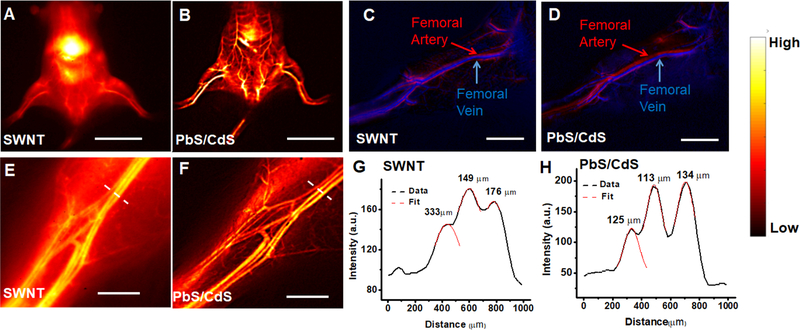
Comparison of vascular imaging in normal mice using PbS/CdS and SWNT vascular contrast dyes. A,B. Whole body fluorescence imaging of mouse hindlimb vasculature after systemic injection of SWNTs by NIR-II imaging (A), in comparison to NIR-IIb imaging of systemically injected PbS/CdS contrast agent (B). C,D. Principal component analysis of femoral artery and vein after intravenous injection of SWNT (C) or PbS/CdS (D). E,F. High magnification NIR-IIb fluorescence images of the hindlimb vasculature after systemic injection of PbS/CdS (F), in comparison to NIR-II imaging of SWNTs (E). G,H. Representative cross-sectional fluorescence intensity profiles of high magnification images (E,F) along white-dashed bars of a mouse injected with either SWNTs (G) or PbS/CdS (H). Gaussian fits to the profiles are shown in red dashed curves. Scale bar: 2 cm (A,B); 5 mm (C,D), 2 mm (E,F).

