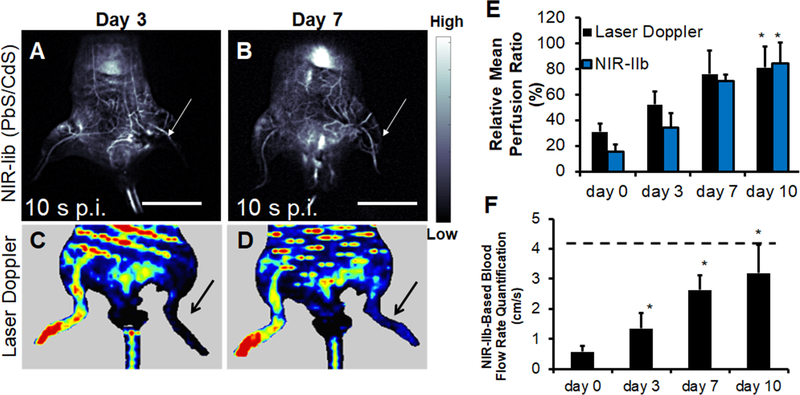
Figure 4.
Quantification of blood perfusion recovery in the ischemic limb by NIR-IIb fluorescence imaging. A-B. NIR-IIb imaging of ischemic hindlimbs mice on days 3 and days 7 using PbS/CdS. Fluorescence images both correspond to the time point of 10 s post-injection (p.i.). C-D. Representative laser Doppler spectroscopy images of ischemic limbs on days 3 and 7, respectively. E. Comparison of relative mean blood perfusion recovery in the ischemic limb by laser Doppler spectroscopy and NIR-IIb fluorescence imaging (n>4). F. NIR-IIb-based quantification of blood flow rate. Dotted line denotes mean flow rate of control non-ischemic limb (n>4). F. Scale bar: 2 cm. Arrow points to ischemic limb. Scale bar: 2 cm (A,B). * P<0.05, compared to day 0.

