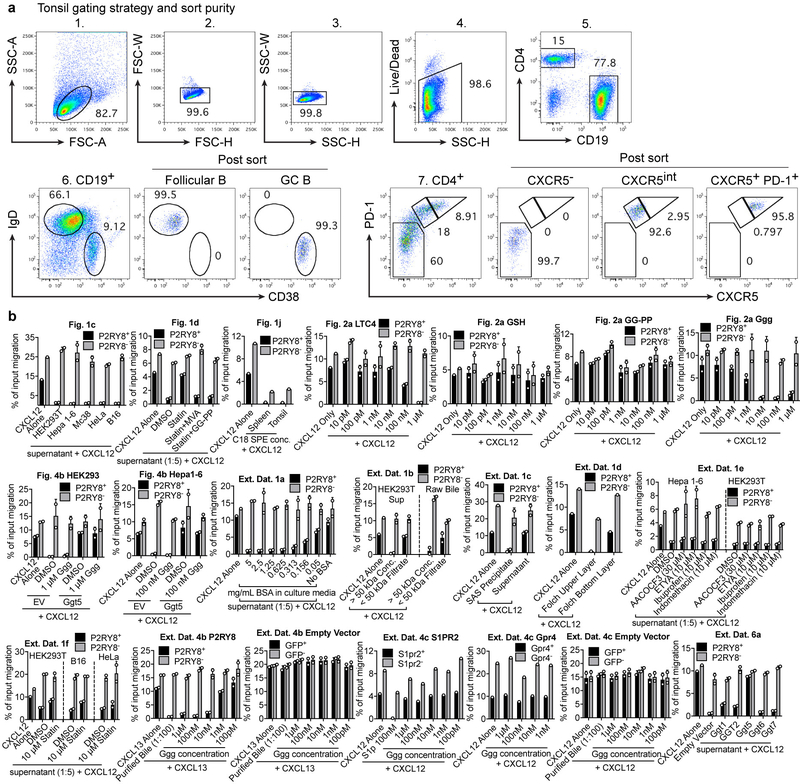
Extended Data Figure 9. FACS gating strategy and purity.
(a) Flow cytometry plots showing gating scheme used to sort the indicated subsets from human tonsil, along with post-sort purity. (b) For each bioassay performed, representative experiments are graphed as % of input migration for both the transduced and un-transduced WEHI-231 subsets indicated. For Fig 1j, the C18 SPE concentrates exhibited inhibition of overall migration likely due to slight toxicity; however, P2RY8+ cells were more selectively inhibited compared to P2RY8- cells. The baseline migration across experiments differs based on the growth state of the WEHI-231 cells. Graphs depict mean with s.d.

