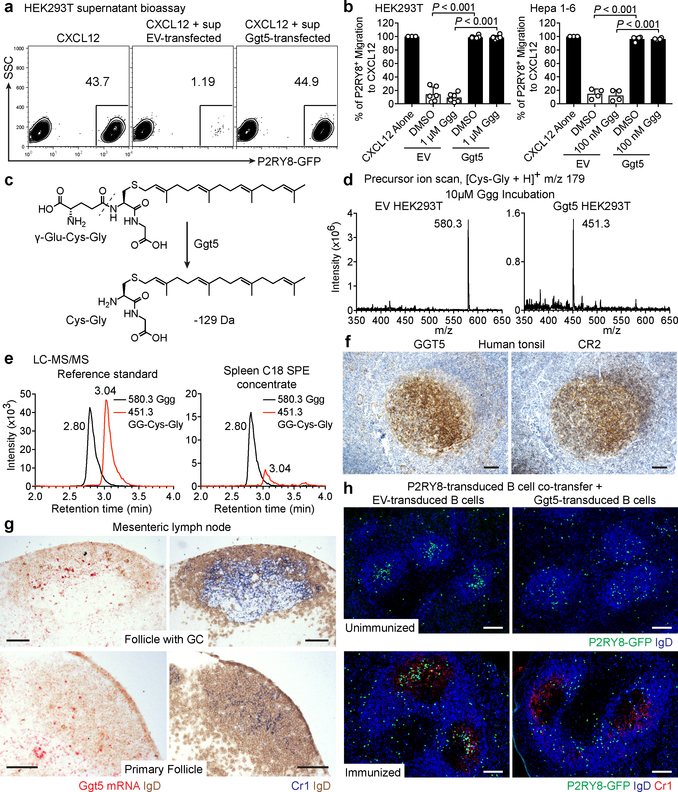
Figure 4. Ggt5 metabolizes Ggg and regulates P2RY8 function in vivo.
(a, b) Flow cytometry plots (a) and summary data (b) of P2RY8 ligand bioassay of supernatants from the indicated cells overexpressing Ggt5 or empty vector (EV), cultured for 18 hr with Ggg or vehicle (HEK293T n=6, Hepa1-6 n=4 biological replicates, one-way ANOVA with Bonferroni’s multiple comparisons test). Graphs depict mean with s.d. (c) Diagram of Ggg conversion into S-geranylgeranyl-L-Cys-Gly (GG-Cys-Gly). (d) Positive precursor ion scan for m/z 179 to identify ions producing [Cys-Gly]+ fragments, from purified supernatants of HEK293T cells overexpressing EV or Ggt5 and incubated with Ggg. (e) LC-MS/MS MRM for Ggg and GG-Cys-Gly in a mixture of 100 nM Ggg and GG-Cys-Gly, or in C18 SPE concentrates of mouse spleen. (f) Immunohistochemistry for GGT5 or CR2 (brown) in serial sections of tonsil counterstained with hematoxylin (blue). (g) RNAscope for Ggt5 mRNA (red) in mouse lymph node GCs and primary follicles, counterstained with IgD (brown). Serial sections were stained for Cr1 (blue) and IgD (brown). (h) Immunofluorescence for P2RY8-overexpressing B cells (GFP, green) co-transferred with EV or Ggt5-overexpressing B cells, in unimmunized mice without GCs (top), and in GCs (Cr1, red) of immunized mice (bottom), relative to endogenous B cells (IgD, blue). Data are representative of or pooled from 3 (a,b,e) or 2 (d,h) experiments, 3 (h) or 5 (f,g) biological replicates. Scale bars, 100 μm.

