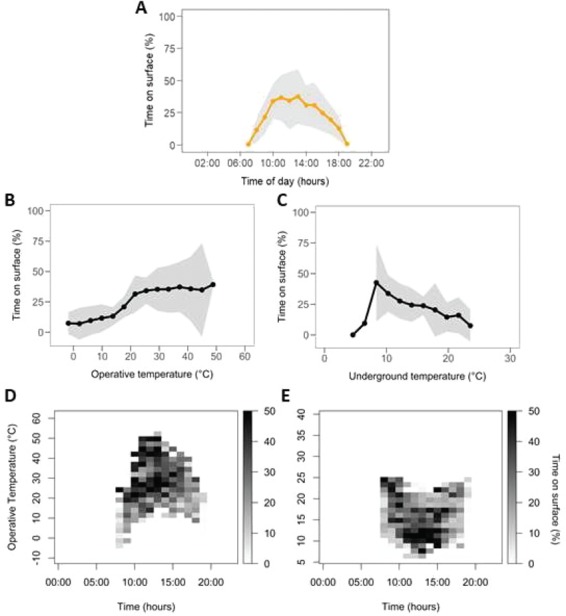
Figure 3.

Average percentage of recordings of animals on surface when kept inside arenas in the field, from April to August of 2015–17, at each time of day (A), each operative temperature interval (B) or each underground temperature (at 20 cm) interval (C). Shaded area: standard deviation between individuals. (A) Sample size: 12 individuals; (B) Sample size for each point respectively: 1, 5, 10, 10, 10, 10, 10, 10, 10, 10, 9, 8, 8, 5, 2; (C) Sample size for each point respectively: 1, 1, 3, 7, 7, 8, 7, 9, 6, 5, 3. Simultaneous effect of time of day and environmental temperature is shown in (D) for operative temperature and (E) for underground temperature. Darker areas indicate intervals of temperature and time of day when percentage time on surface was higher.
