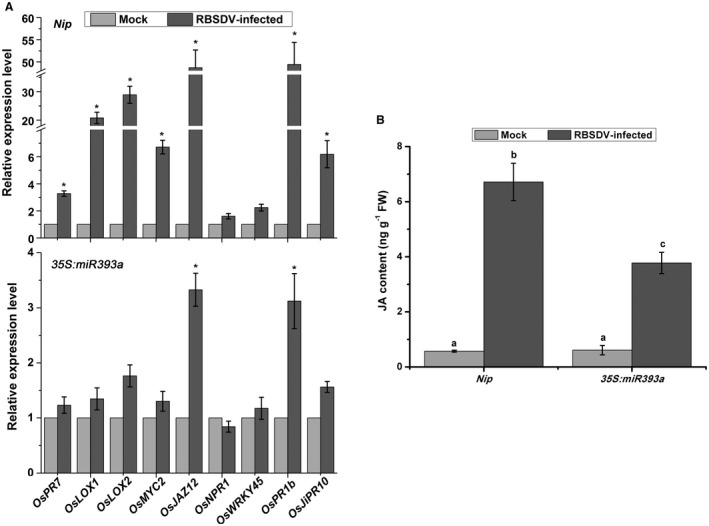
Figure 5.

The effect of repressing auxin signalling on jasmonic acid (JA) or salicylic acid (SA) pathway genes in response to RBSDV infection. (A) The expression of JA pathway or SA pathway genes in the Nip controls (upper panel) or 35S:miR393a mutant (bottom panel) in response to RBSDV infection. Data are shown as relative expression levels in virus‐infected plants in comparison to the control plants. UBQ5 was used as the internal reference gene. Values are means ± SD of three biological replicates. Statistically significant differences from the control are indicated: *P ≤ 0.05. (B) The content of JA in Nip controls or 35S:miR393a mutant in response to RBSDV infection. Values are means ± SD of three biological replicates. Different letters at the top of columns indicate significant differences at P ≤ 0.05 (n = 3).
