FIGURE 4.
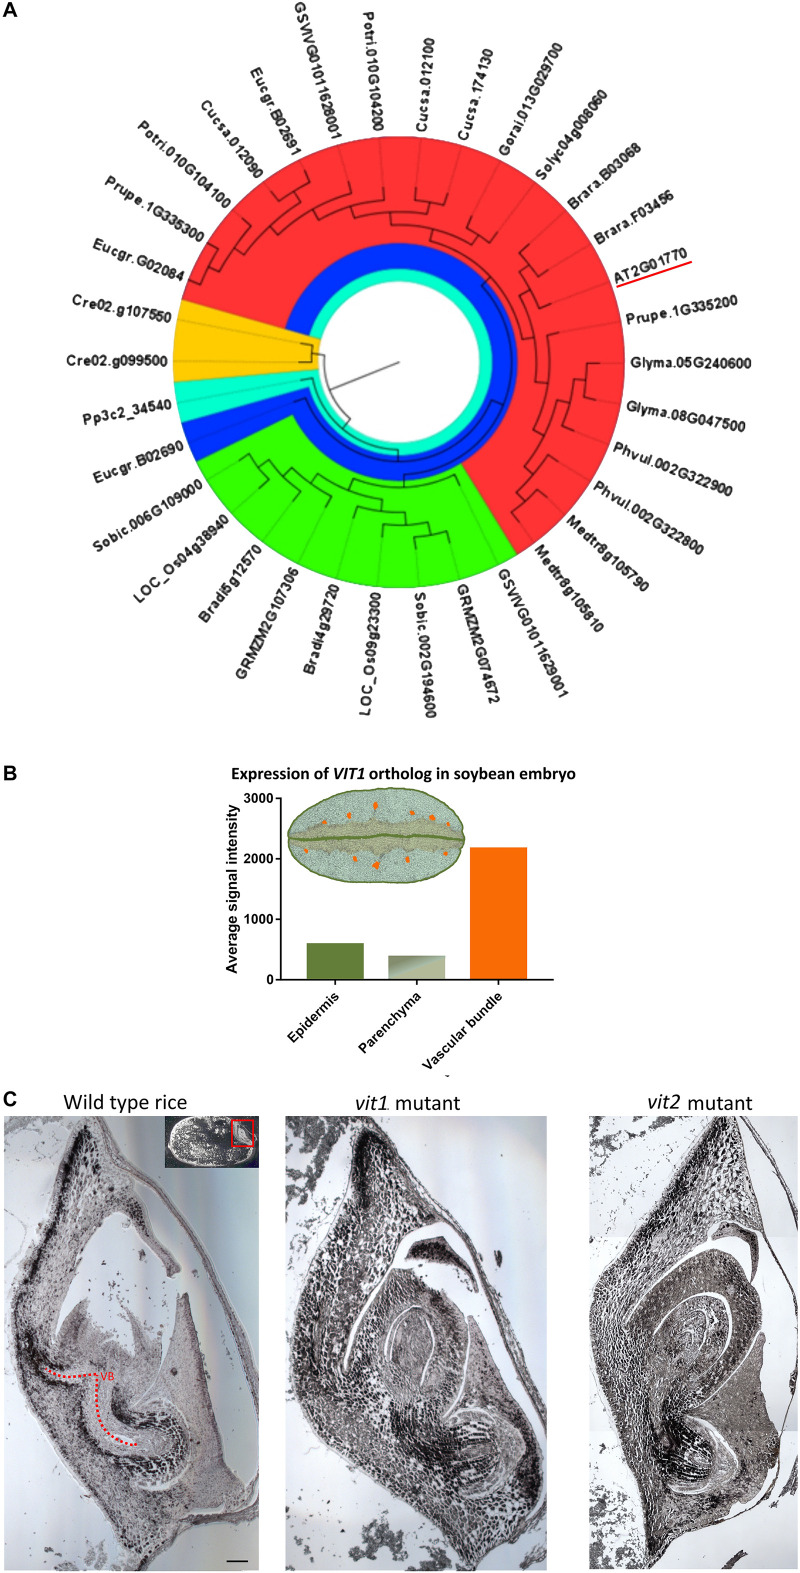
Conservation of VIT1 sequence, expression and function. (A) Phylogenetic distribution of VIT1 orthologs in 18 different plant species from monocots, dicots and lower plants. Phylogeny was constructed by MEGA 7 with ML method for 1000 bootstraps using putative 34 VIT1 protein sequences. The red segment includes only dicots. Green segment includes only monocots except for one member of Vitis vinifera. The blue segment shows a diverged dicot member of E. grandis. Orange and cyan colors show algal and moss species, respectively. VIT1 from Arabidopsis thaliana is underlined. For details on analyzed sequences, refer to materials and method section. (B) Expression of VIT1 ortholog (Glyma01g40600) in embryo tissues of soybean (Microarray data retrieved from www.seedgenenetwork.net). The picture illustrates the soybean (Glycine max) tissues: green, epidermis; orange vascular bundles; rest, parenchyma. (C) Impact of VIT1 orthologs in Fe distribution of rice (Oryza sativa) embryo. Unlike dicots, monocots such as rice do not have well defined organs. Longitudinal sections of whole rice embryos were obtained from either wild type or mutant rice (VIT1 or VIT2 genes were either substantially knocked down or knocked out), stained by Perls/DAB (black color) and Fe distribution in the embryos were compared. Region with red line corresponds to provascular bundles (VB) in rice embryo. Red arrow heads point specific Fe accumulation pattern around provasculature. Bar is 0.1 mm.

