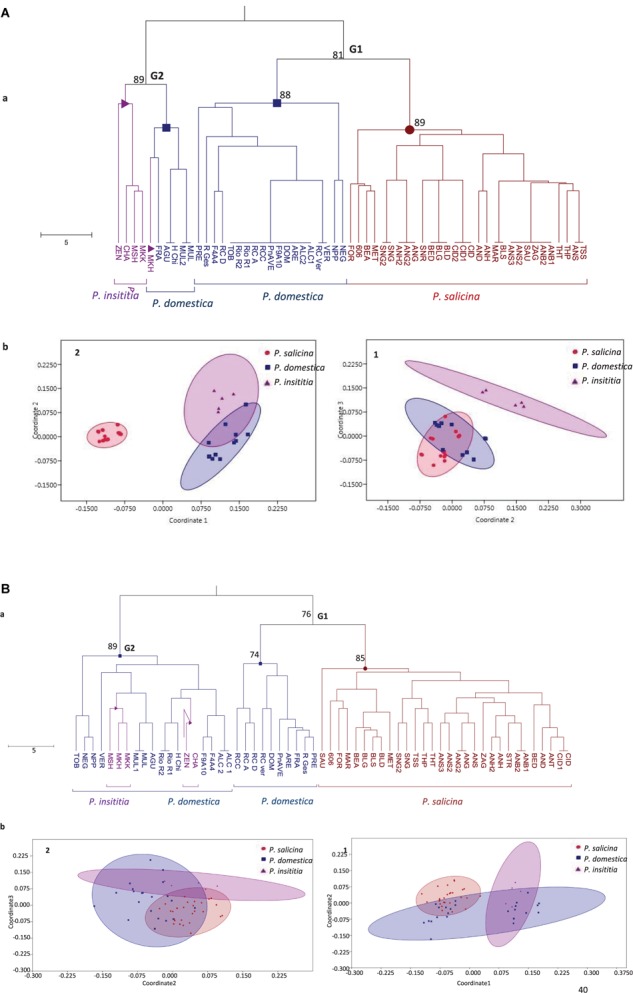
FIGURE 3.

Genetic relationships between the 59 tested plums based on (A) S-locus data and (B) SSR data. (a) UPGMA tree. Numbers on major branches represent bootstrap support from 2000 replicates. (b) Non-metric multidimensional scaling MDS plots: (1) using dimensions 2–3. (2) using dimensions 1–2.
